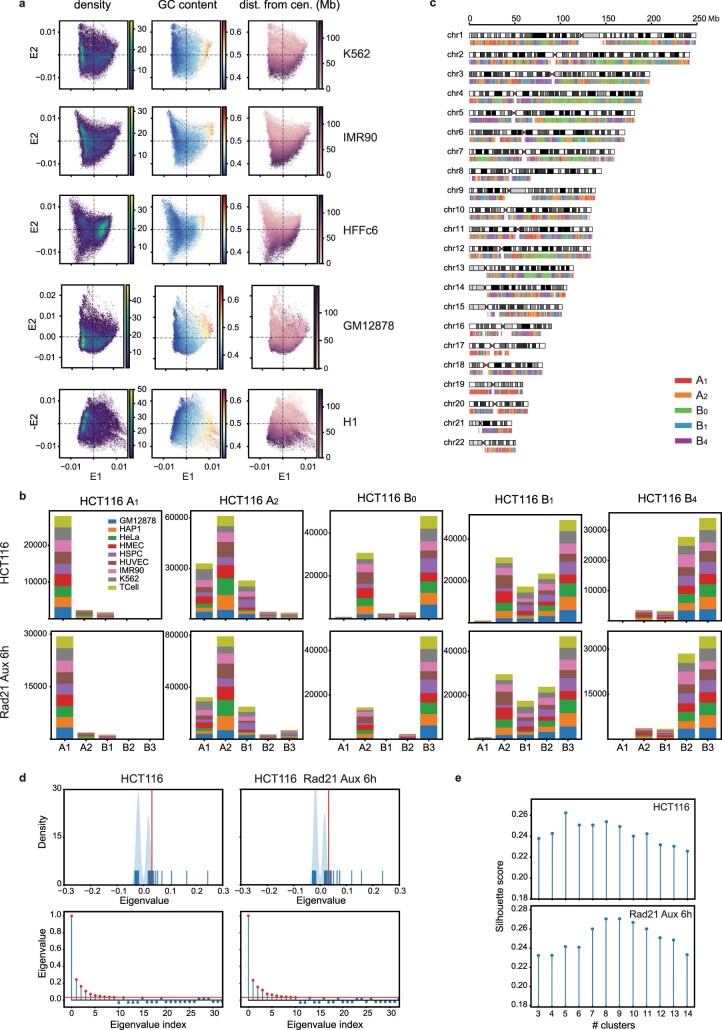
Extended Data Fig. 1. Spectral decomposition and clustering in HCT116.
(a) E1 vs. E2 scatter plots of 50 kb genomic bins from five additional cell types (K562, IMR-90, HFFc6, GM12878, H1-hESC) colored by point density (left), GC content (middle), and distance from centromere (right). (b) Distributions of SNIPER subcompartment labels assigned to genomic bins in each IPG across nine other cell types for HCT116 (top) and HCT116 RAD21-degron (bottom). (c) Ideogram plot of IPGs in HCT116. (d) Top, rug plot of the leading 128 eigenvalues for HCT116 (left) and HCT116 RAD21-degron (right). Vertical red line indicates the eigenvalue cutoff. Bottom, same eigenvalues plotted in descending order of absolute value. Eigenvalues corresponding to retained vectors used for clustering are indicated in red. (e) Silhouette scores calculated for k-means clustering on eigenvectors from HCT116 (top) and HCT116 RAD21-degron (bottom) as a function of the number of clusters, k.

