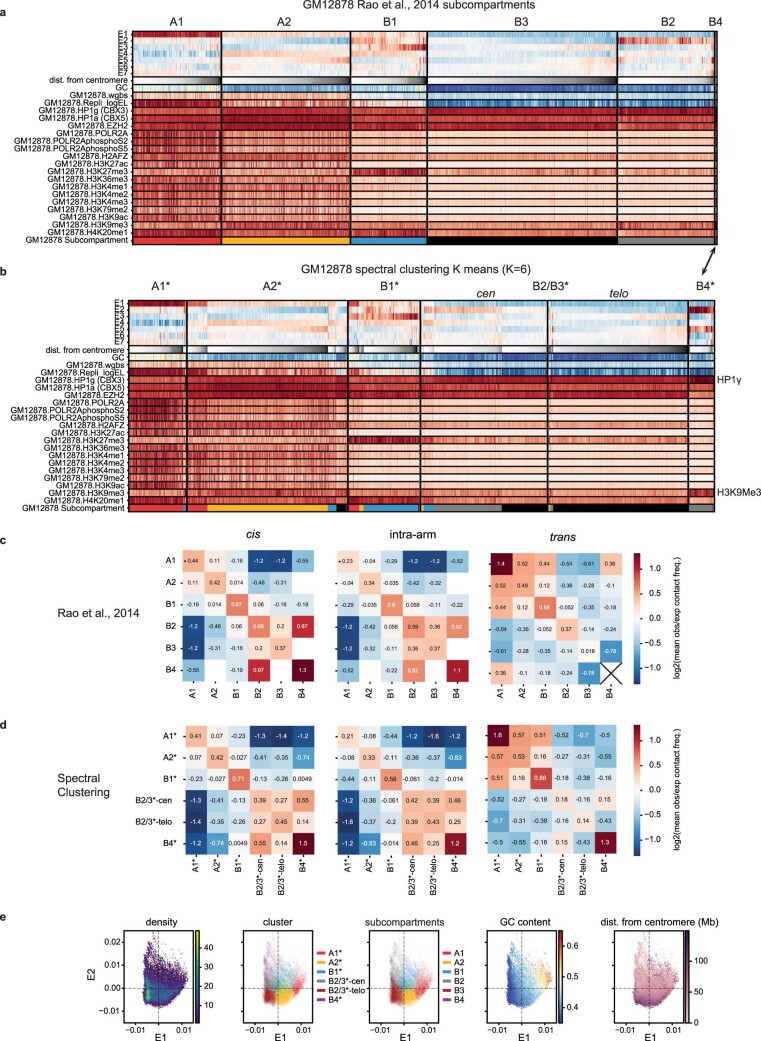
Extended Data Fig. 2. Spectral decomposition and clustering in GM12878.
(a) Feature heatmap for GM12878 based on 6-subcompartment labels from (Rao et al.4). The tracks displayed are the seven leading eigenvectors (E1-E7), GC content, fraction CpG methylation, replication timing (Early/Late), and ChIP-seq for a range of factors and histone modifications. Columns (50-kb bins) within each subcompartment are sorted by distance from centromere. Colors are assigned to the subcompartment labels in the last row (A1: red, A2: yellow, B1: blue, B2: grey, B3: black). (b) Feature heatmap for GM12878 based on spectral clustering of E1-E7 (k = 6). Rows display the same tracks as in (A). Columns within each cluster are sorted first by subcompartment label assignment, then by distance from centromere. The last row assigns a color to each bin based on its subcompartment label as in (A). Names are assigned to the clusters based on similarity to (A) with addition of an asterisk. The main differences with Rao et al.4, subcompartment assignments are (1) a more balanced division between B2* and B3* based on centromere/telomere proximity and (2) an expanded sixth cluster, B4*, that acquires B3 loci having highly enriched H3K9me3 and HP1γ. (c) Heatmaps of pairwise mean observed/expected contact frequency between subcompartments in (Rao et al.4) based on cis (left), intra-arm (middle), and trans (right) contacts. (d) Heatmaps of pairwise mean observed/expected contact frequency, as in (C), but between spectral clusters from (B). (e) E1 vs. E2 scatter plots from GM12878 colored by point density, GC content, spectral cluster label, subcompartment label, and distance from centromere.

