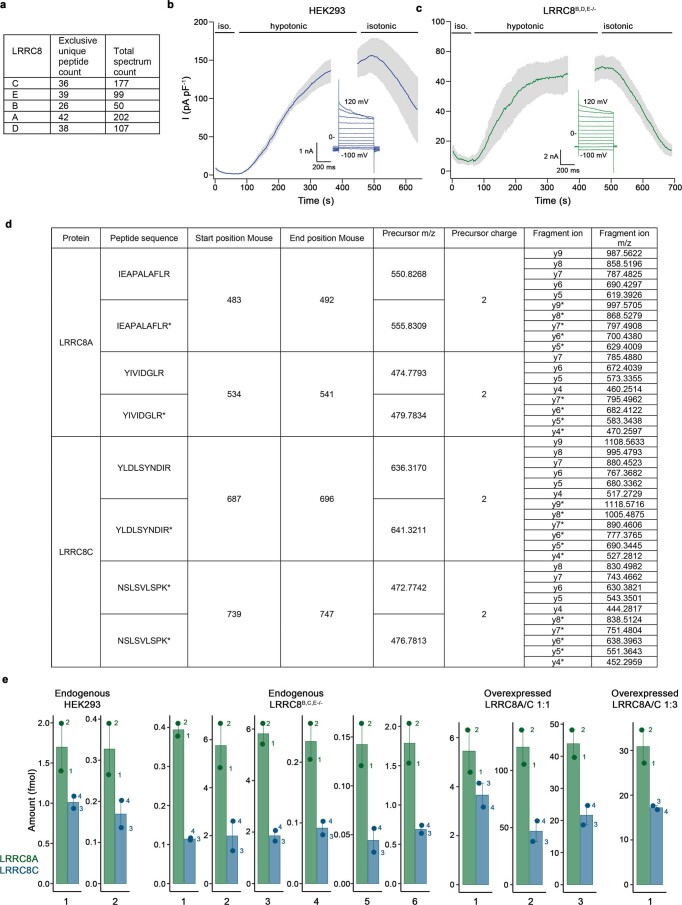
Extended Data Fig. 1. Mass spectrometry and electrophysiology.
a, Identification of all five subunits in isolated endogenous LRRC8 complexes from HEK293T cells by shotgun LC-MS/MS. b, c, VRAC currents recorded in the whole-cell configuration in response to a change of the extracellular environment to hypotonic conditions. Values show average of three biological replicates recorded at 100 mV in, b, HEK293T and, c, LRRC8B,D,E,-/- cells. Errors are s.e.m. The changes in extracellular osmolarity are indicated (top). Insets show traces of a representative cell recorded at different voltages at the plateau of activation. d, LRRC8A/C precursor and product ion masses used for absolute quantification. Asterisk denotes heavy labeled residues. e, Determination of absolute peptide levels in isolated LRRC8 complexes using LC-MS/MS. Peptide amounts on column (fmol) were calculated using the ratio of endogenous and SIL (stable-isotope labeled) peptides: IEAPALAFLR (1) and YIVIDGLR (2) from LRRC8A and NSLSVLSPK (3) and YLDLSYNDIR (4) from LRRC8C. Graphs show individual biological replicates with bars representing the average of the two peptides belonging to the same subunit.

