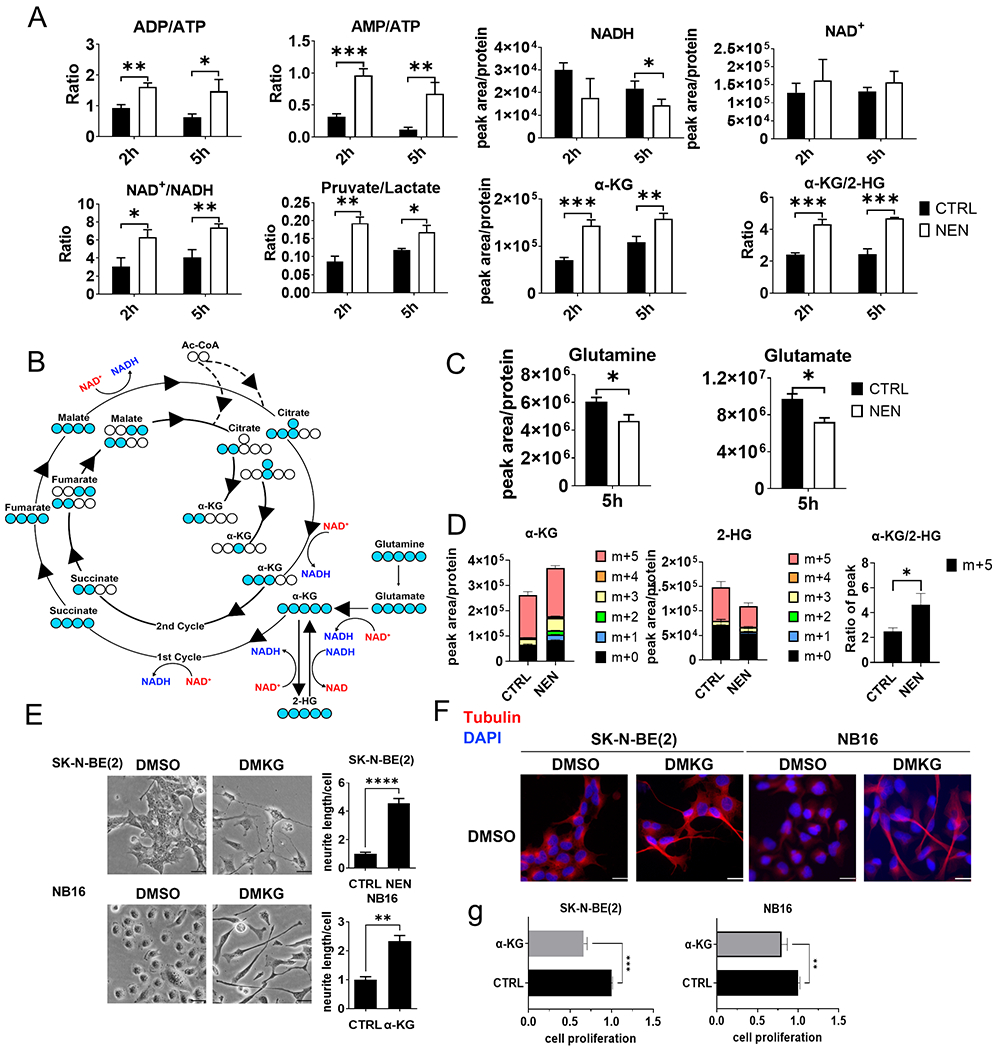
Figure 2. NEN treatment increases the NAD+/NADH ratio to accelerate glutaminolysis.

(A) Relative metabolite levels in SK-N-BE(2) cells treated with DMSO or 1 μM NEN measured using LC-MS. (B) 13C-labeling patterns of TCA cycle metabolites derived from U-13C-glutamine (Blue circle: 13C; hollow circle: 12C. (C) Relative L-glutamine and L-glutamate levels in SK-N-BE(2) cells treated with DMSO or 1 μM NEN for 5 h. (D) SK-N-BE(2) cells were pretreated with DMSO or 1 μM NEN for 3 h, then labeled with U-13C-glutamine for 2 h. (E) Left: morphological feature of cells treated with/without 3.5 mM DMKG for 96 h (scale bar: 50 μM). Right: Quantification of neurite outgrowth with NeuronJ. (F) Immunofluorescence staining for β-tubulin III (red) and DAPI (blue) in cells treated as in (E; scale bar: 25μm). (G) Cells treated with/without 3.5 mM DMKG for 3 d. All cell numbers were normalized to the control group. Key, *, p < 0.05, **, p < 0.01, ***, p < 0.001 based on a Student’s two-tailed t-test.
