
Figure 5. NEN supplementation reduces NB growth in vivo.
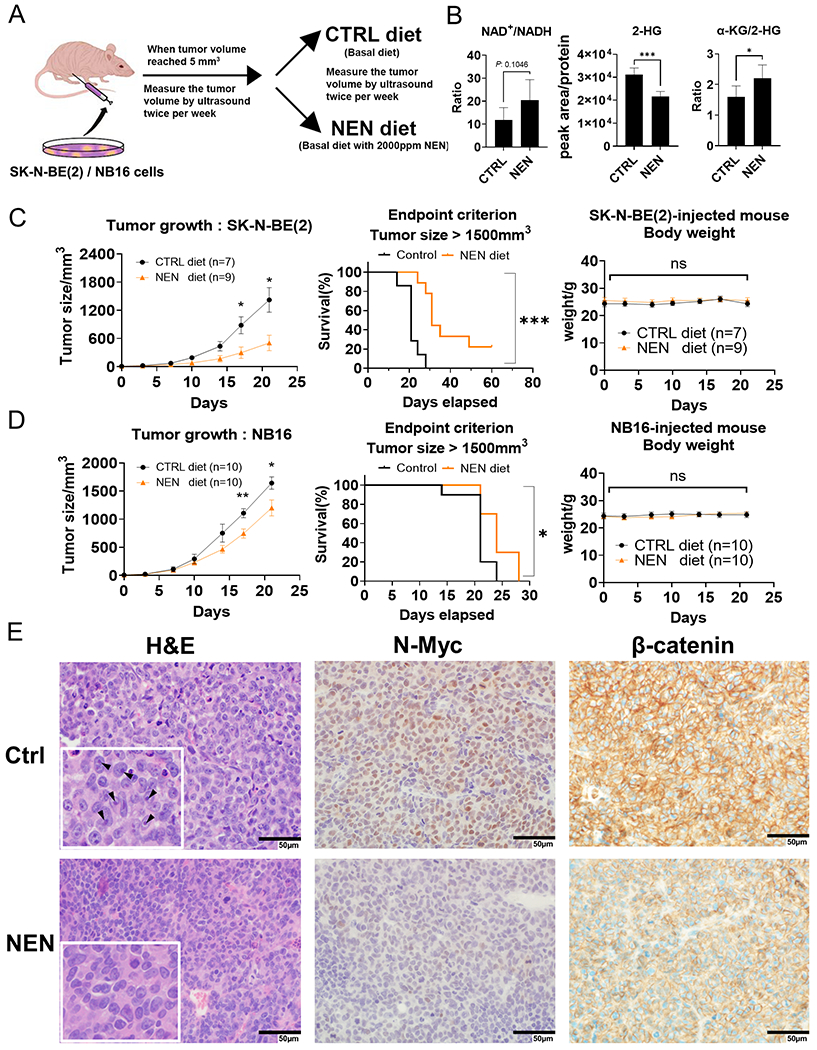
(A) Schematic of in vivo orthotopic NB xenograft experiment. (B) LC-MS-based relative metabolite levels in tumor samples (n=5). (C, D) The mice’s tumor growth, survival, and body weight curves. (E) H&E-stained tumors in control and NEN groups stained for N-Myc and β-catenin (scale bar: 50 μm); arrows indicate prominent enlarged nucleolar formations. Key: ns, p > 0.05; *, p < 0.05; **, p < 0.01; ***, p < 0.001 based on a Student’s two-tailed t-test.