
Figure 6. NEN treatment induces gene expression profile changes that indicate a favorable prognosis in NB patients.
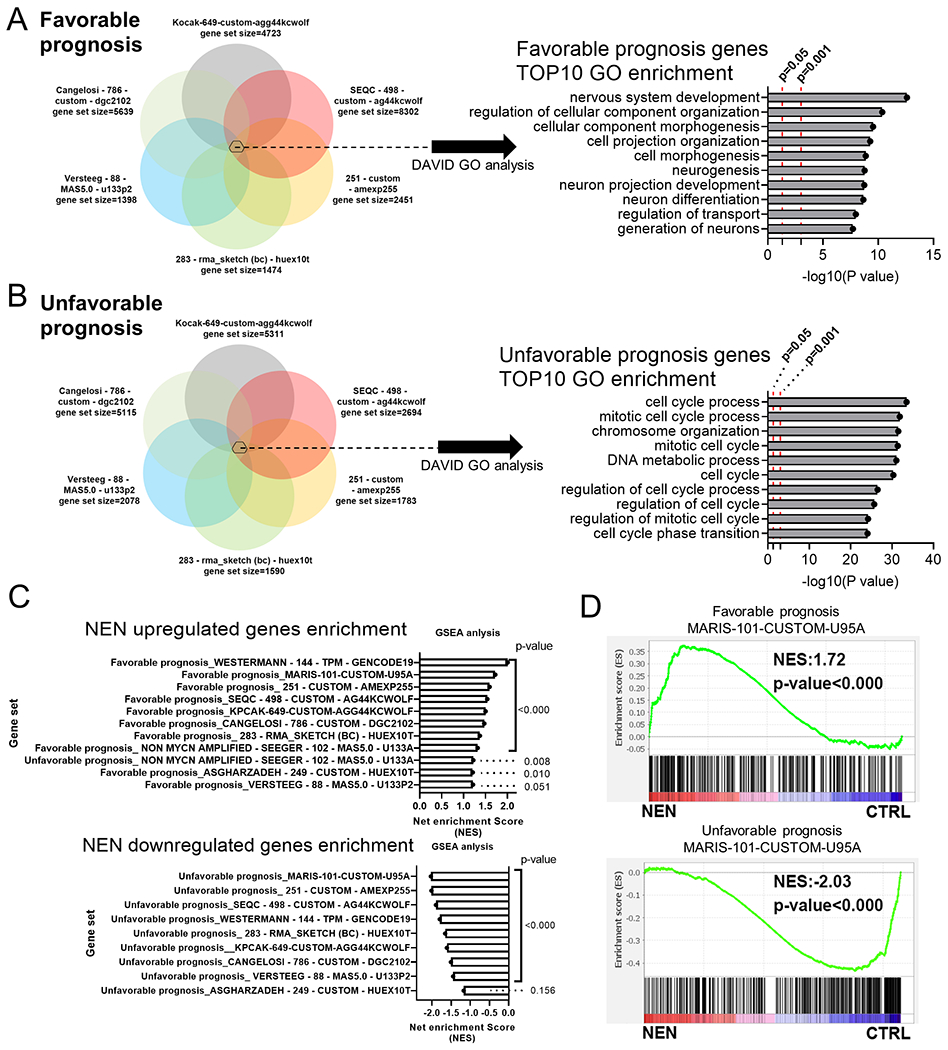
GO enrichment of (A) overlapping favorable prognosis genes (p < 0.05; >1000 genes) and (B) overlapping unfavorable prognosis genes (p < 0.05; >1000 genes) from seven available NB datasets submitted for DAVID analysis. (C) GSEA enrichment in RNA-seq gene expression data (n=3). The gene sets (favorable or unfavorable prognosis; p < 0.05) were created from 10 available NB datasets in the R2 database. (D) Representative GSEA analysis plot from (C).