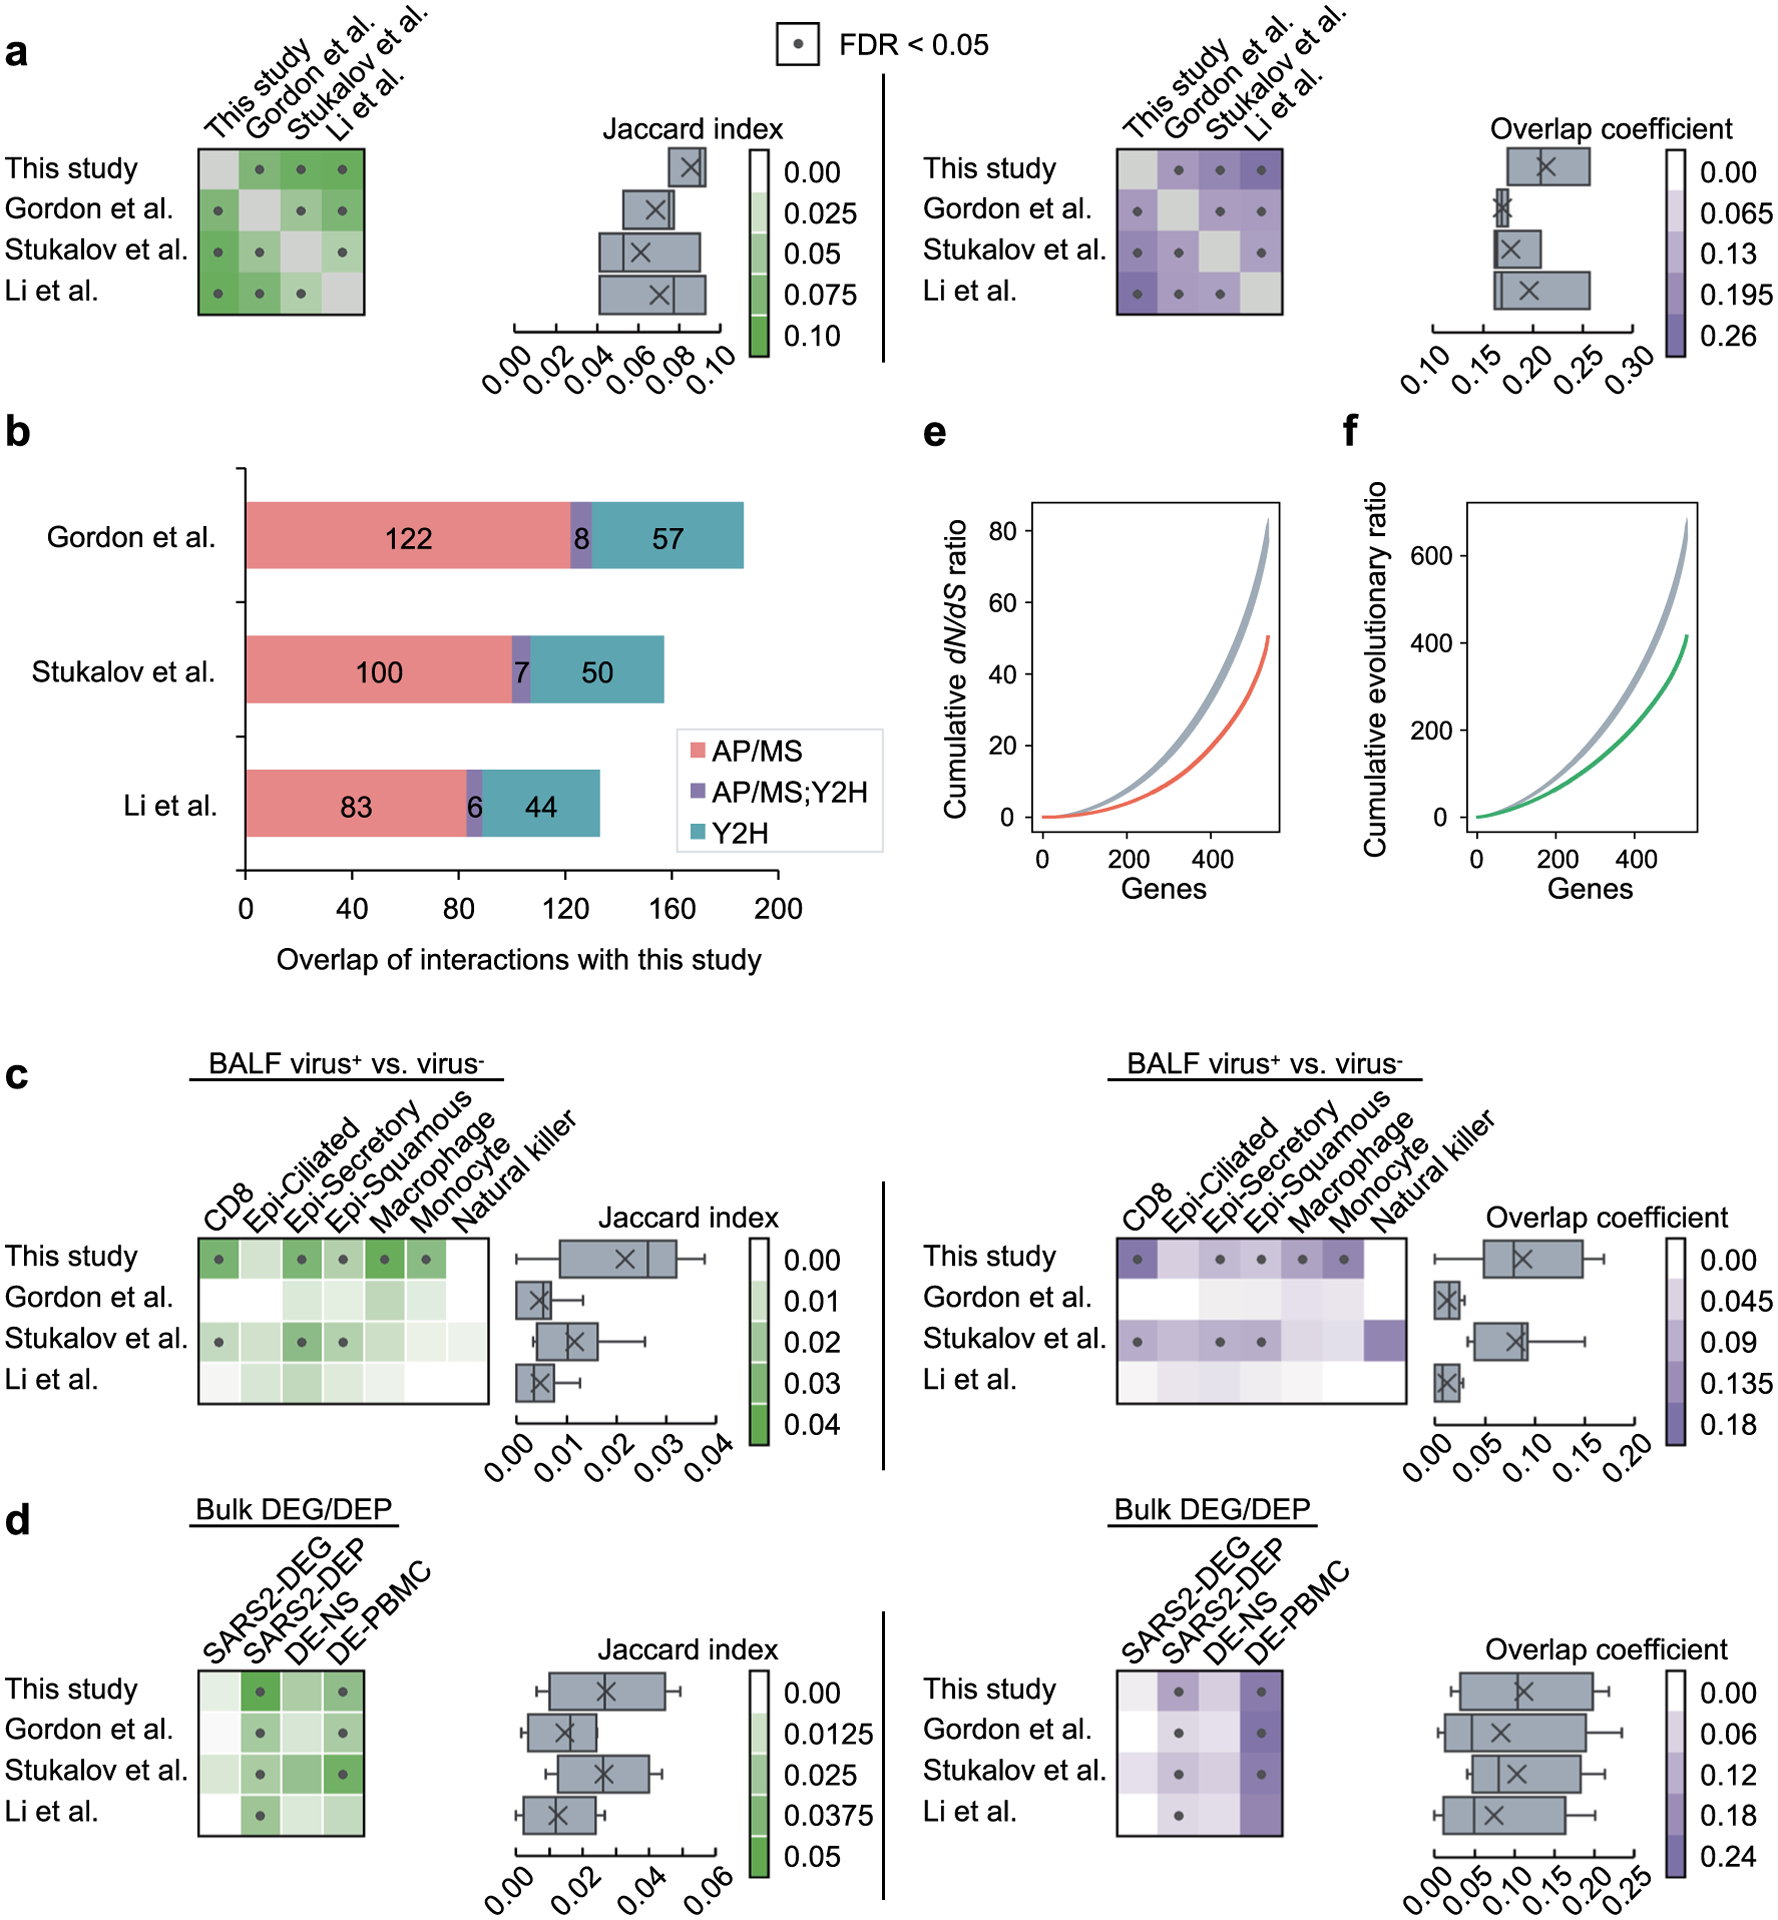
Extended Data Fig. 1 |. Characteristics of the interactome.

(a) Overlap of the host factors among the four interactomes compared in this study. Heatmaps show the Jaccard indexes (green) and overlap coefficients (purple) of the host factors against other gene sets. Dots indicate FDR < 0.05 by Fisher’s exact test. In the box plots, boxes range from lower to upper quartiles, center lines indicate medians, whiskers show 1.5 × interquartile ranges and crosses show mean values. (b) The overlap of the interactions in our interactome with the other three interactomes by considering the protein complexes and pathways. If two host factors interacting with the same viral protein are known to interact with each other in the literature, we consider the two viral-host interactions as overlapping. (c) Overlap of the host factors with the differentially expressed genes in SARS-CoV-2+ vs. SARS-CoV-2− cells in seven cell types from COVID-19 patient samples. Epi - epithelial. (d) Overlap of the host factors with the differentially expressed genes from four bulk RNA-seq/proteomics datasets. (e, f) Biological characteristics of the SARS-CoV-2 host factors. The host factors have lower non-synonymous to synonymous substitutions (dN/dS) ratios (e) and lower evolutionary ratios (f) compared to random background (gray, mean ± standard deviation of 100 repeats using genes randomly selected by degree preserved node shuffling). Genes were sorted in ascending order in terms of dN/dS ratio or evolutionary ratio.
