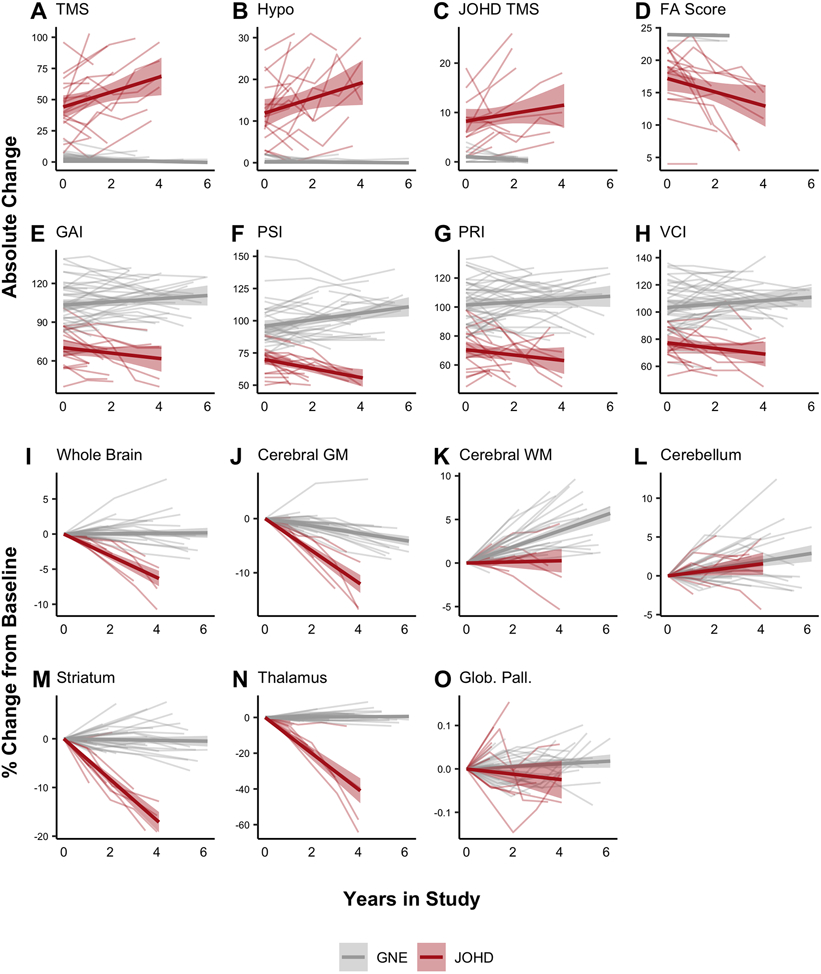
Figure 2. Longitudinal Changes in Clinical and Neuroimaging Measures Between Groups.
Longitudinal clinical data was available for 18 patients with JOHD and 42 participants in the GNE group. Patients with JOHD had a faster rate of worsening in regards to motor (A-C), functional (D), and cognitive (E-H) outcomes compared to the GNE group.
Longitudinal neuroimaging data were available for 11 patients with JOHD and 35 participants in the GNE group. Patients with JOHD had faster annualized percent decreases in the volume of the whole brain (I), and cerebral GM (J) compared to the GNE group. The JOHD participants seemed to have slower developmental increases in cerebral WM (K) compared to the GNE group. The trajectory of change in the percent volume change of the cerebellum did not differ between groups (L). The JOHD group experienced longitudinal atrophy in the striatum (M) and thalamus (N) compared to the GNE group. The annualized percent change over time in volume of the globus pallidus (O) did not differ between groups.
The thin gray and red lines are the raw, connected data points for each individual participant. The bold gray and red lines represent the predicted fit of the raw values from a linear model and the accompanying shaded areas represent the predicted 95% confidence interval.
FA: Functional Assessment; GAI: General Ability Index; Glob. Pall.: Globus Pallidus; GM: Gray Matter; GNE: Gene-Non-Expanded; Hypo: Hypokinesia Score; ICV: Intracranial Volume
JHD TMS: Juvenile HD Motor Scale; JOHD: Juvenile-Onset Huntington Disease; PRI: Perceptual Reasoning Index; PSI: Processing Speed Index; TMS: Total Motor Score; VCI: Verbal Comprehension Index; WM: White Matter

