
Fig. 4. PAG rapidly induces BNP gene expression in vitro and in vivo.
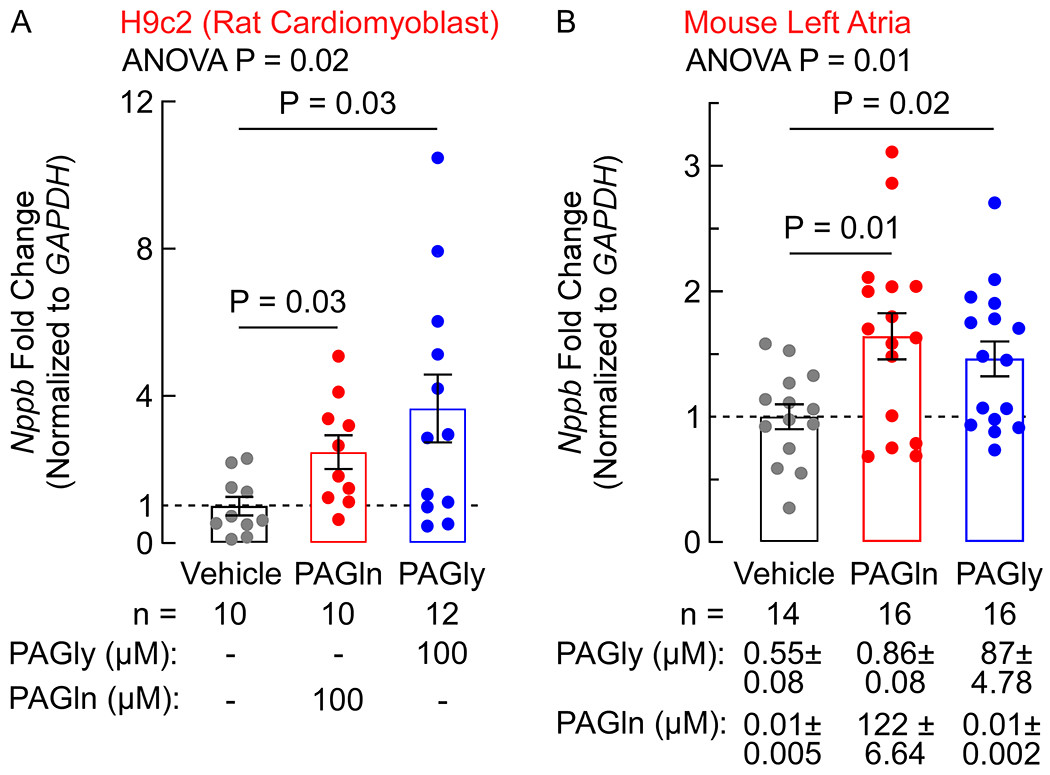
(A) Fold-change of BNP (Nppb) gene expression in H9c2 rat cardiomyoblasts, normalized to GAPDH, after 4 h exposure to 100 μM PAGln or PAGly measured in the indicated number of replicates (n=10–12 as indicated). (B) Fold-change of BNP (Nppb) gene expression in isolated left atria, normalized to GAPDH, 15 min after IP injection of PAGln (50 mg/kg), PAGly (50 mg/kg), or vehicle control measured in the indicated number of animals (n=14–16 as indicated). Circulating plasma levels of PAGln and PAGly (mean ± SEM μM) are indicated below the graph. One-way ANOVA followed by Tukey’s multiple comparison test listed. All bars represented the mean ± SEM and dots indicate single data points.