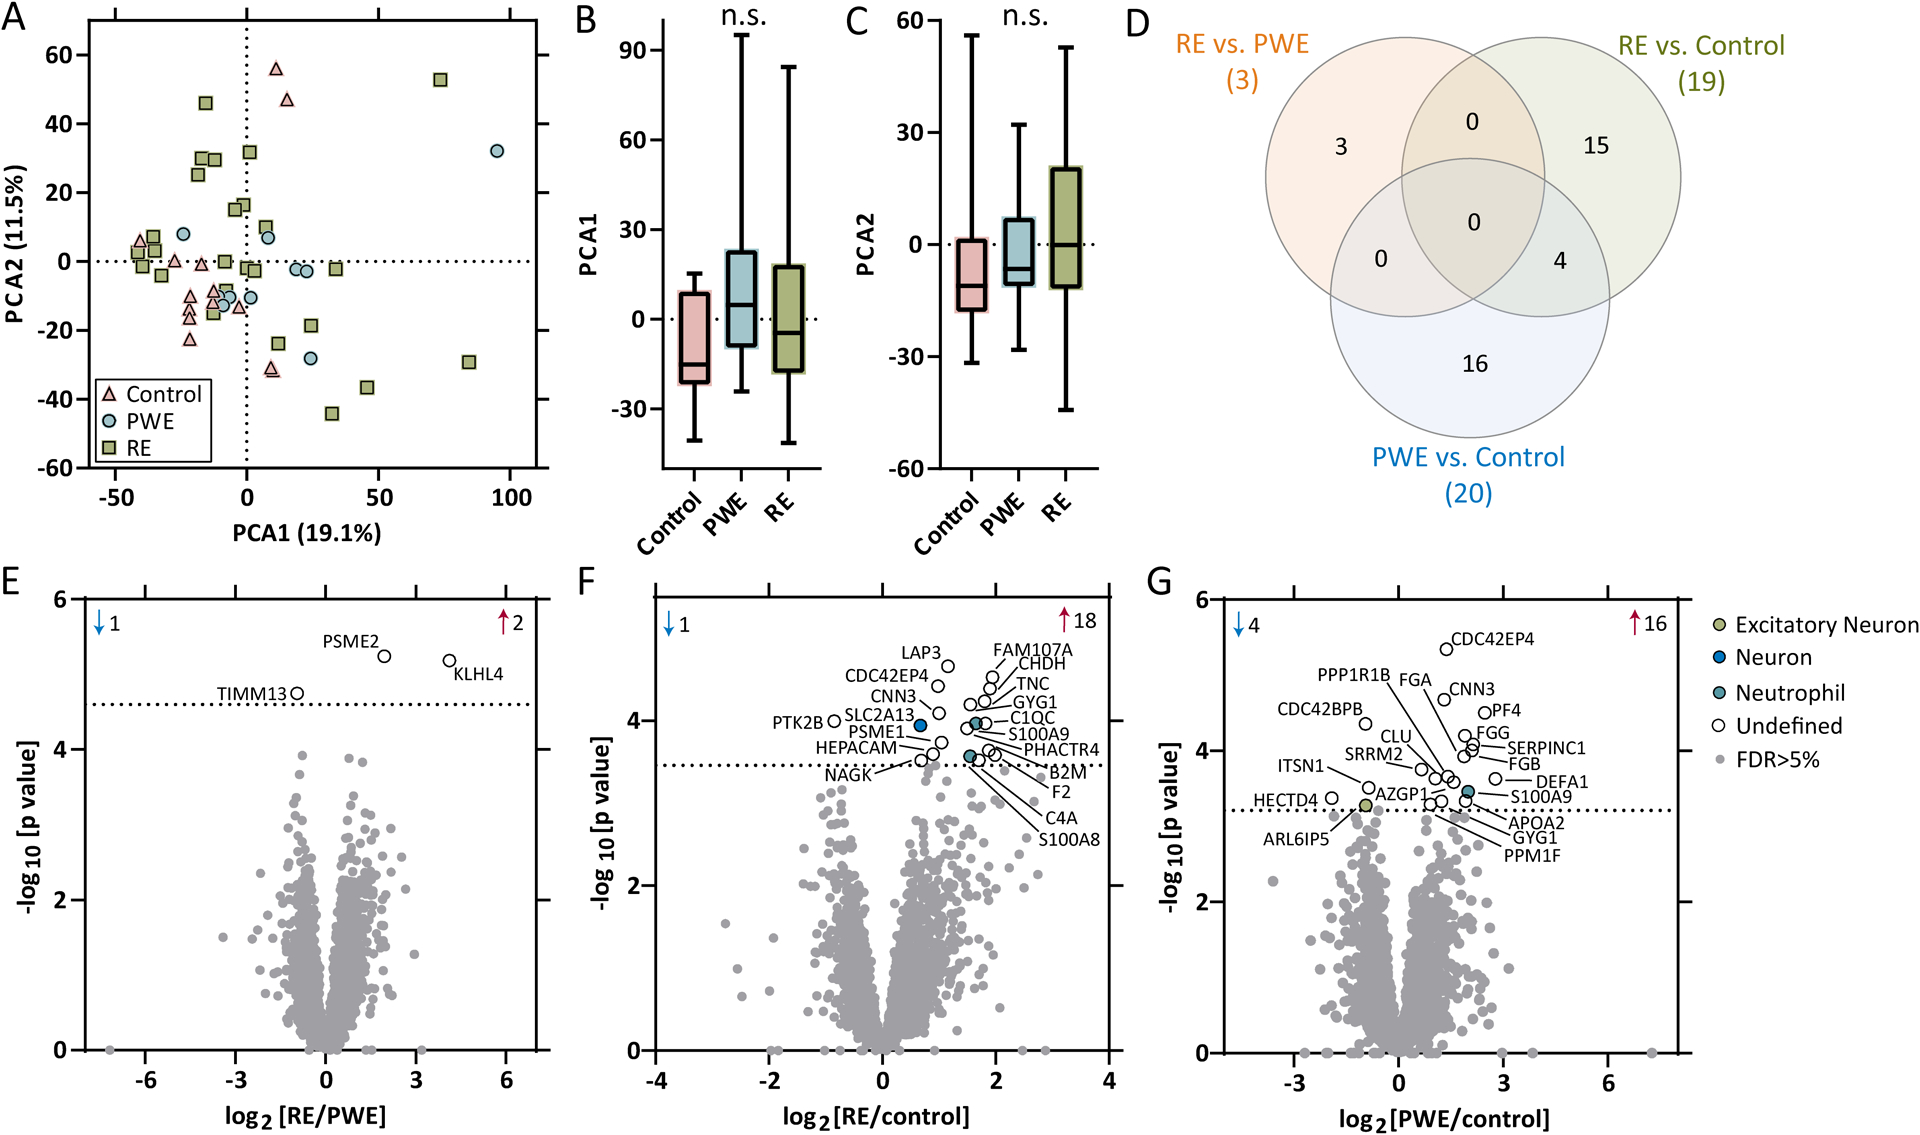
Figure 4. Proteomics PCA and differential expression analysis.

A-C) PCA of proteomics (control: n = 14, PWE: n = 10, RE: n = 25) in brain tissue indicated no segregation of groups. D) Differential expression analysis for each pairwise comparison are indicated, as well as overlap in the number of significant transcripts, at a 5% FDR (dotted line), when comparing E) RE vs. PWE (3 proteins), F) RE vs. control (19 proteins), and G) PWE vs. control (20 proteins). Annotations include the number of significantly increased (red arrow) and decreased (blue arrow) transcripts, all altered proteins are annotated by gene name, and brain and immune cell type annotations for each significant protein are indicated.
