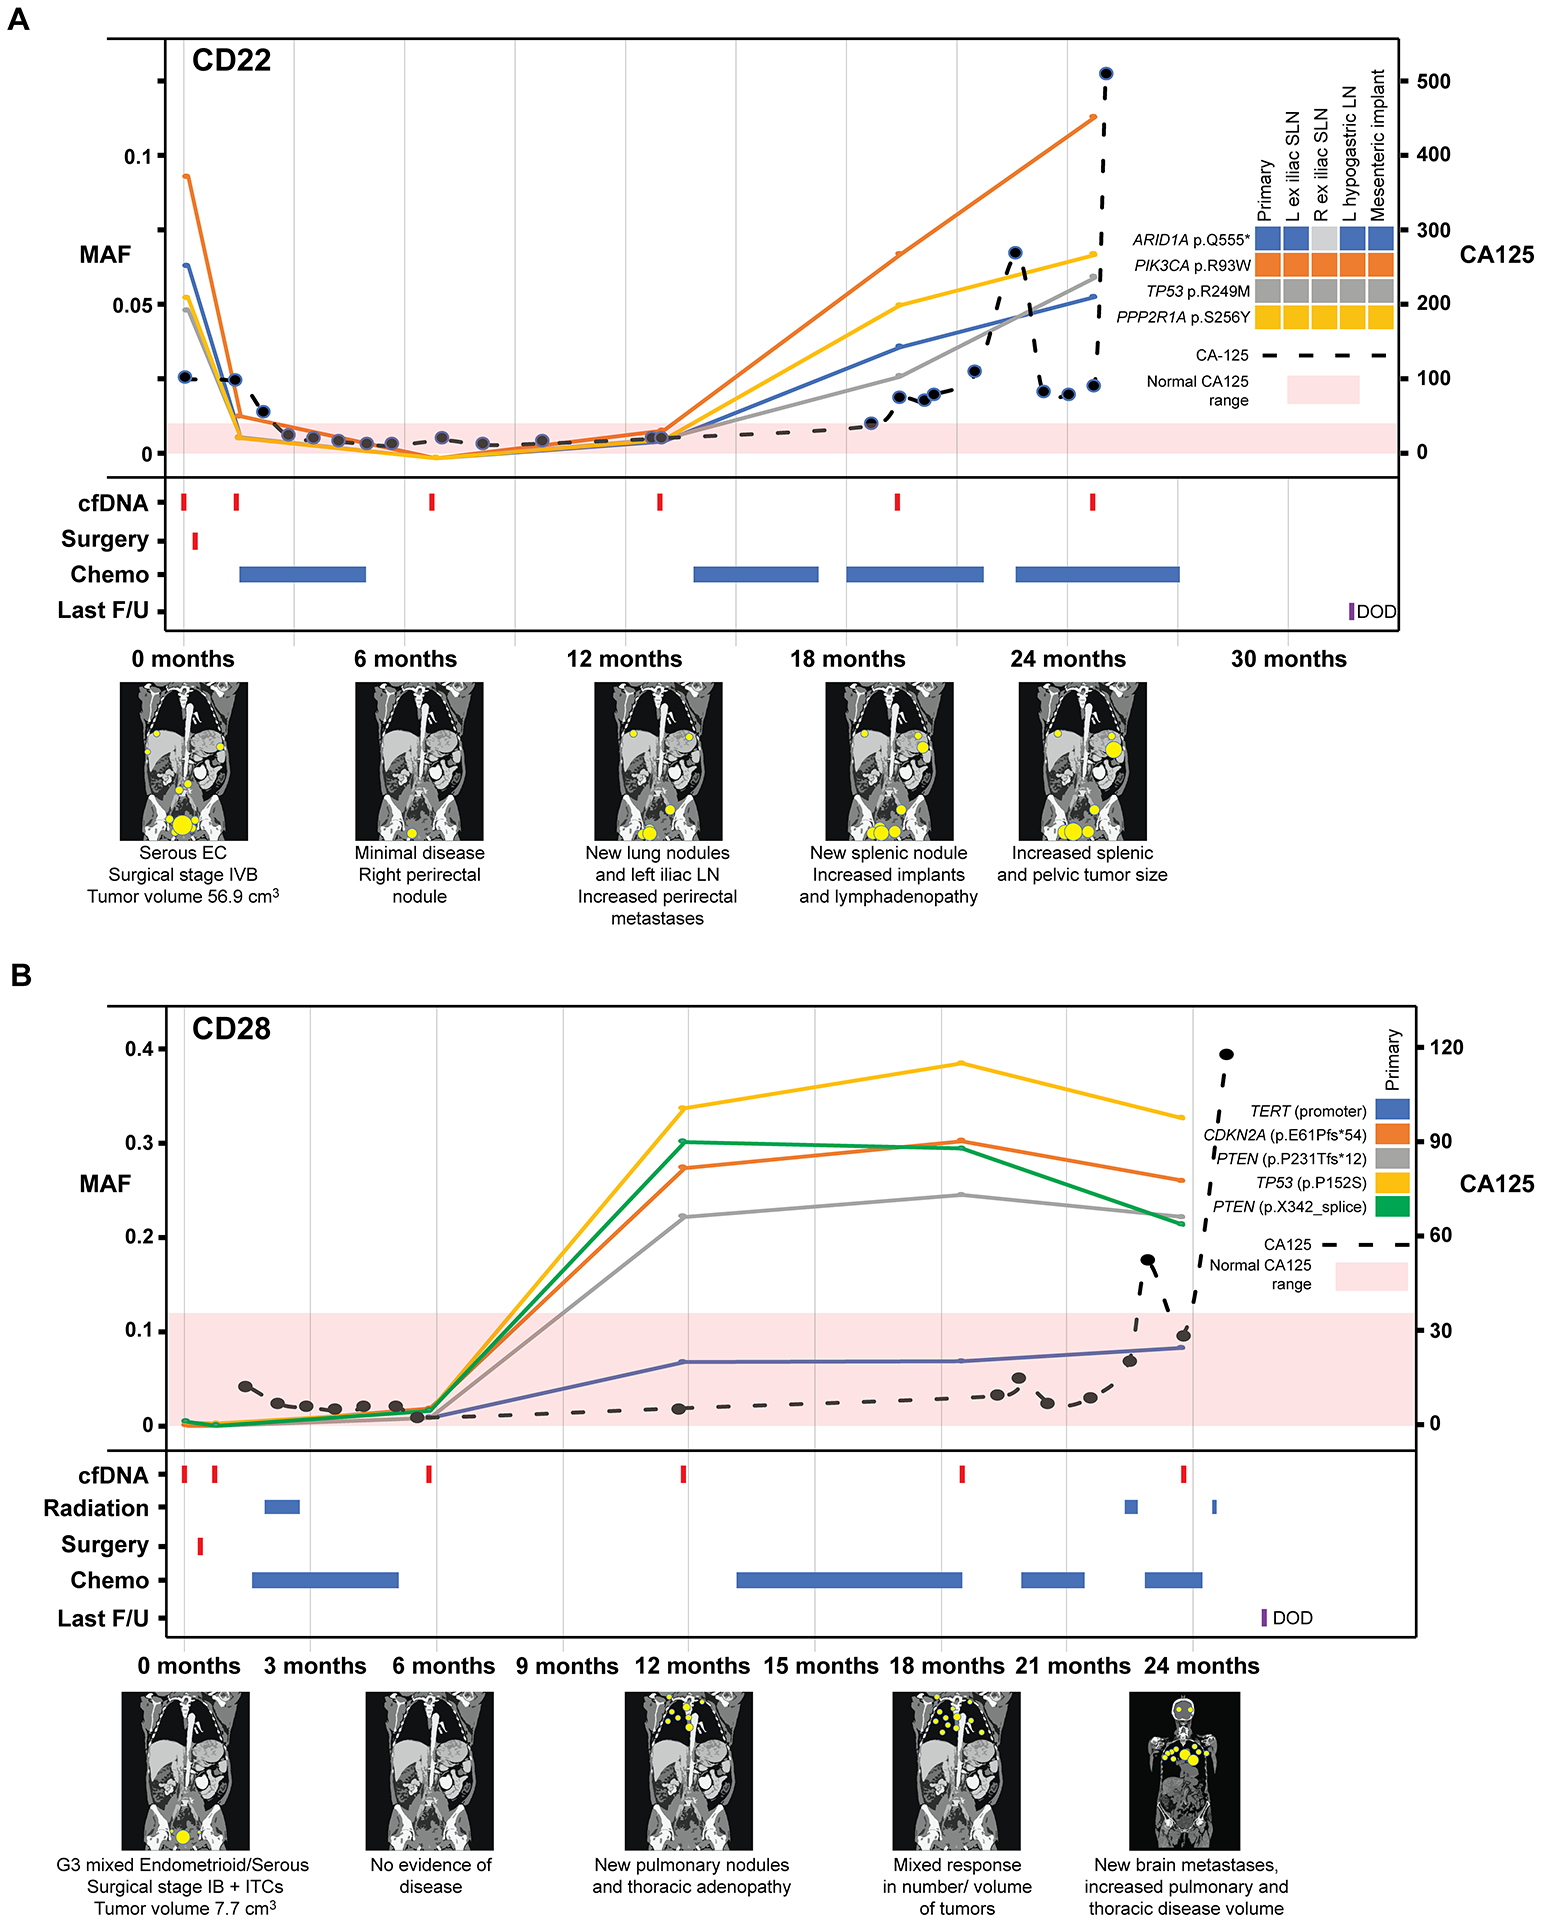
Figure 4. Longitudinal disease monitoring by sequencing of plasma-derived cfDNA samples from patients CD22 and CD28 with newly diagnosed endometrial cancer and comparison with serum CA125 levels.

A, Case CD22, B, Case CD28 with detectable pre-operative circulating tumor (ct) DNA and corresponding graphs of mutation allele frequencies (MAFs) according to the time of blood collection, treatment timeline and a pictographic representation of disease burden. MAFs of mutation in plasma DNA (left y-axis) extracted from peripheral blood samples obtained at baseline, post-surgery and serially every 6 months during follow-up, color-coded according to the legend. The serum CA125 levels (right y-axis) in U/ml are shown by a dashed line, with <35 U/mL CA125 being the normal range. Below the graph, information about surgery, radiation therapy, chemotherapy, last follow-up, and schematic radiographic representations of disease burden are shown. DOD, dead of disease; EC, endometrial cancer; F/U, follow-up; ITCs, isolated tumor cells in the lymph nodes; MAF, mutant allele fraction; ND, not determined.
