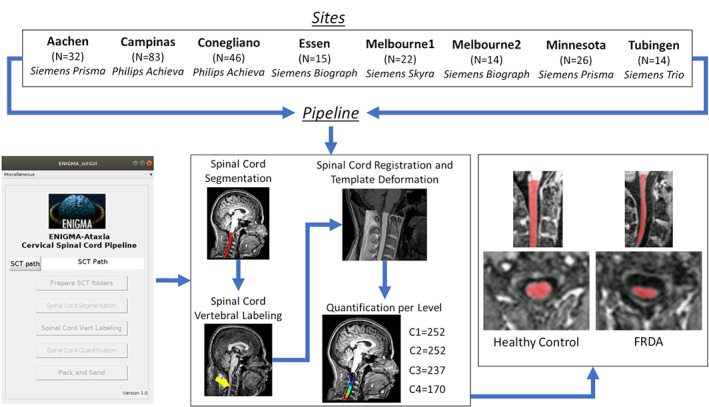
FIG 1.

Study design and imaging processing pipeline. For healthy control subject numbers, see Supporting Information Table S S1. N is the number of patients with Friedreich's ataxia (FRDA) enrolled by each site, and C1, C2, C3, and C4 are the sample sizes available for each vertebral level assessed. SCT, Spinal Cord Toolbox. [Color figure can be viewed at wileyonlinelibrary.com]
