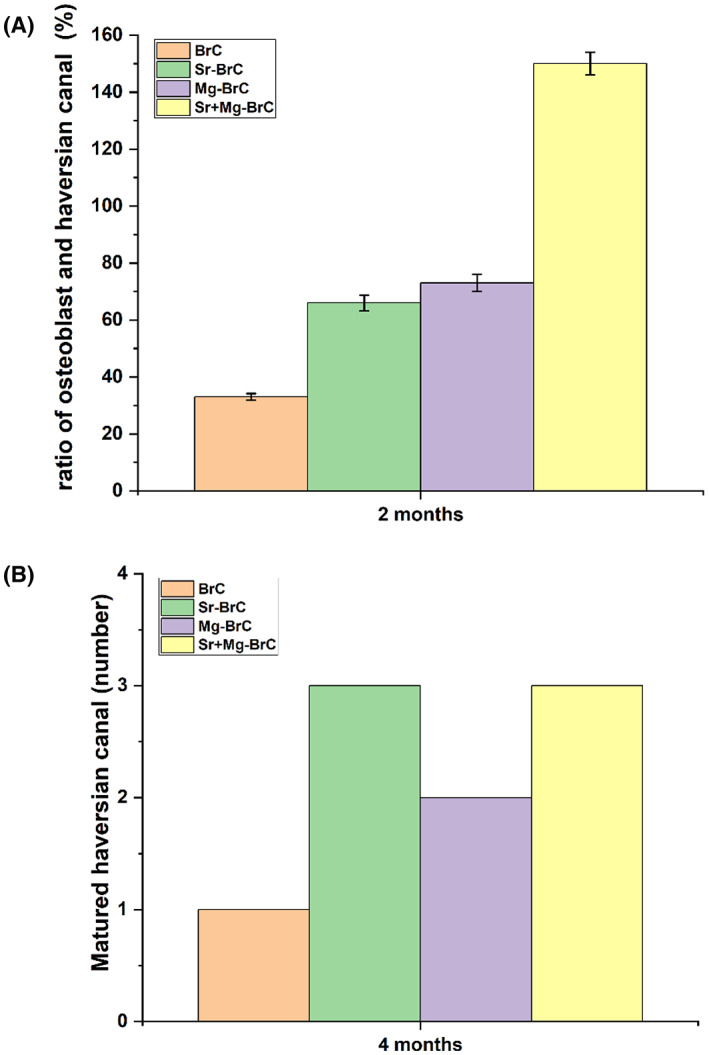
FIGURE 6.

(A) The ratio of osteoblast and Haversian canal (%) after 2 months of implantation. All treatment samples show a significantly higher ratio than control (** denotes p < .0001). (B) The number of matured Haversian canals in each sample. Treatments show a higher number of canals than the control
