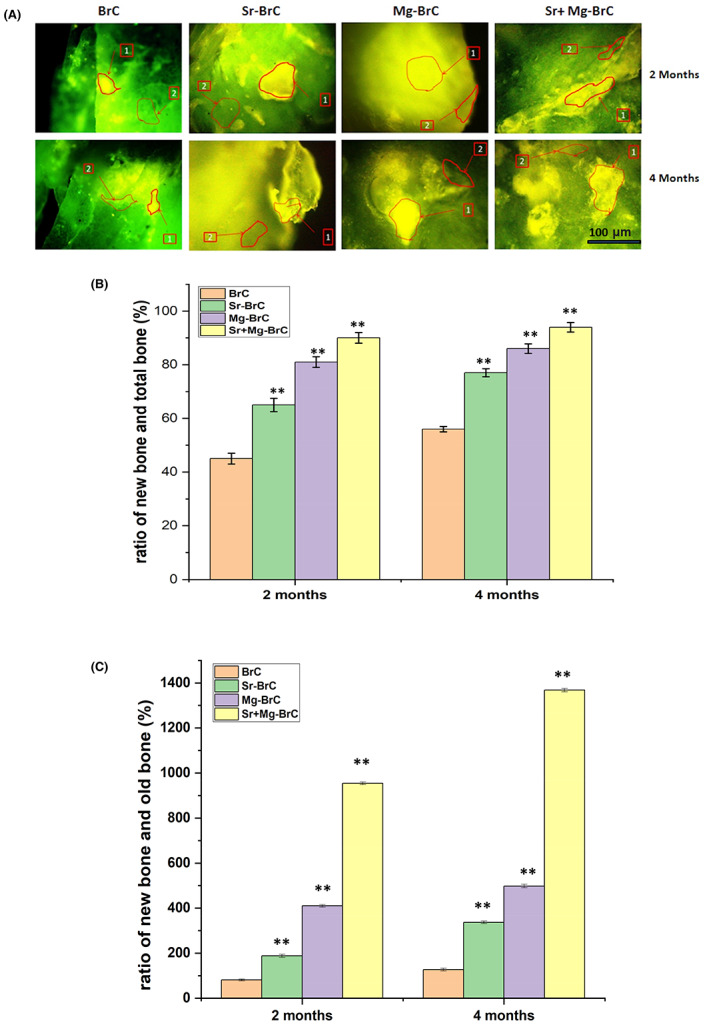
FIGURE 7.

(A) Fluorochrome labeling images depicted bone formation in 2 and 4 months for the pure and doped BrC cement. (1) Golden yellow fluorescence‐ new bone (2) Sea green fluorescence‐ old bone. (B) The ratio of new bone formation with total bone (C) the ratio of new bone formation with old bone, as calculated from the ImageJ software. The statistical data analysis shows a significant difference between the treatment and control. (** denotes p < .0001)
