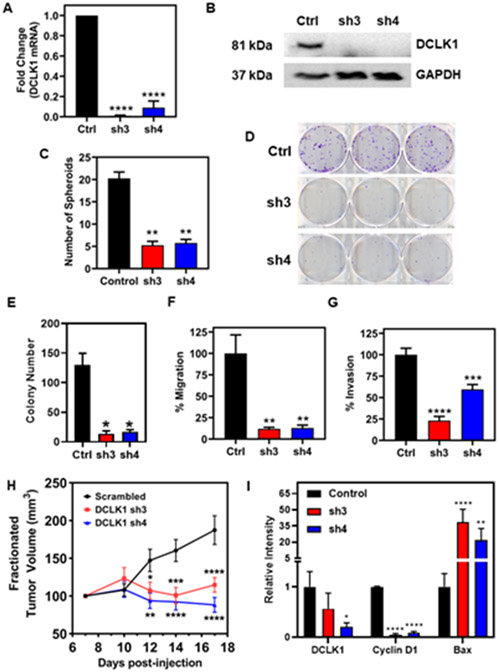
Figure 2. DCLK1 suppression inhibits tumor growth, invasion, and migration.
(A) Fold change in mRNA expression of DCLK1 in FaDu cells stably transduced with shRNA targeting DCLK1 (termed: sh3 and sh4) relative to cells transduced with a scrambled control shRNA. Data represent cumulative results from three independent experiments with ± SEM. (B) Western blot of DCLK1 protein in control and stably knocked down DCLK1 sh3 and sh4 FaDu clones. GAPDH served as a loading control. (C) Quantification of spheroid number from spheroid formation assay. Data represent cumulative results from two independent experiments with ± SEM (D) Representative images of colony formation assays for DCLK1 control, sh3 and sh4 FaDu clones. (E) Quantification of colony number. Data represents cumulative results from three independent experiments with ± SEM (F) Migration and (G) invasion assays are normalized for differences in proliferation rates over the duration of the assay. Data represents cumulative results from three independent experiments with ± SEM. (H) Tumor volumes from NSG mice that were inoculated subcutaneously with 1x10⁶ FaDu cells stably transduced with shRNA targeting DCLK1 (sh3 and sh4) or scrambled control shRNA into their right flank (n=10 animals per group). Tumor measurements began 7 days post-injection of cells. Error bars represent ± SEM (I) Quantification of western blot analysis from lysates of a cohort of xenograft tumors. Error bars represent ± SEM (Western blots shown in Supplementary Figure 5A) *p<0.05, **p<0.01, ***p<0.001, ****p<0.0001.

