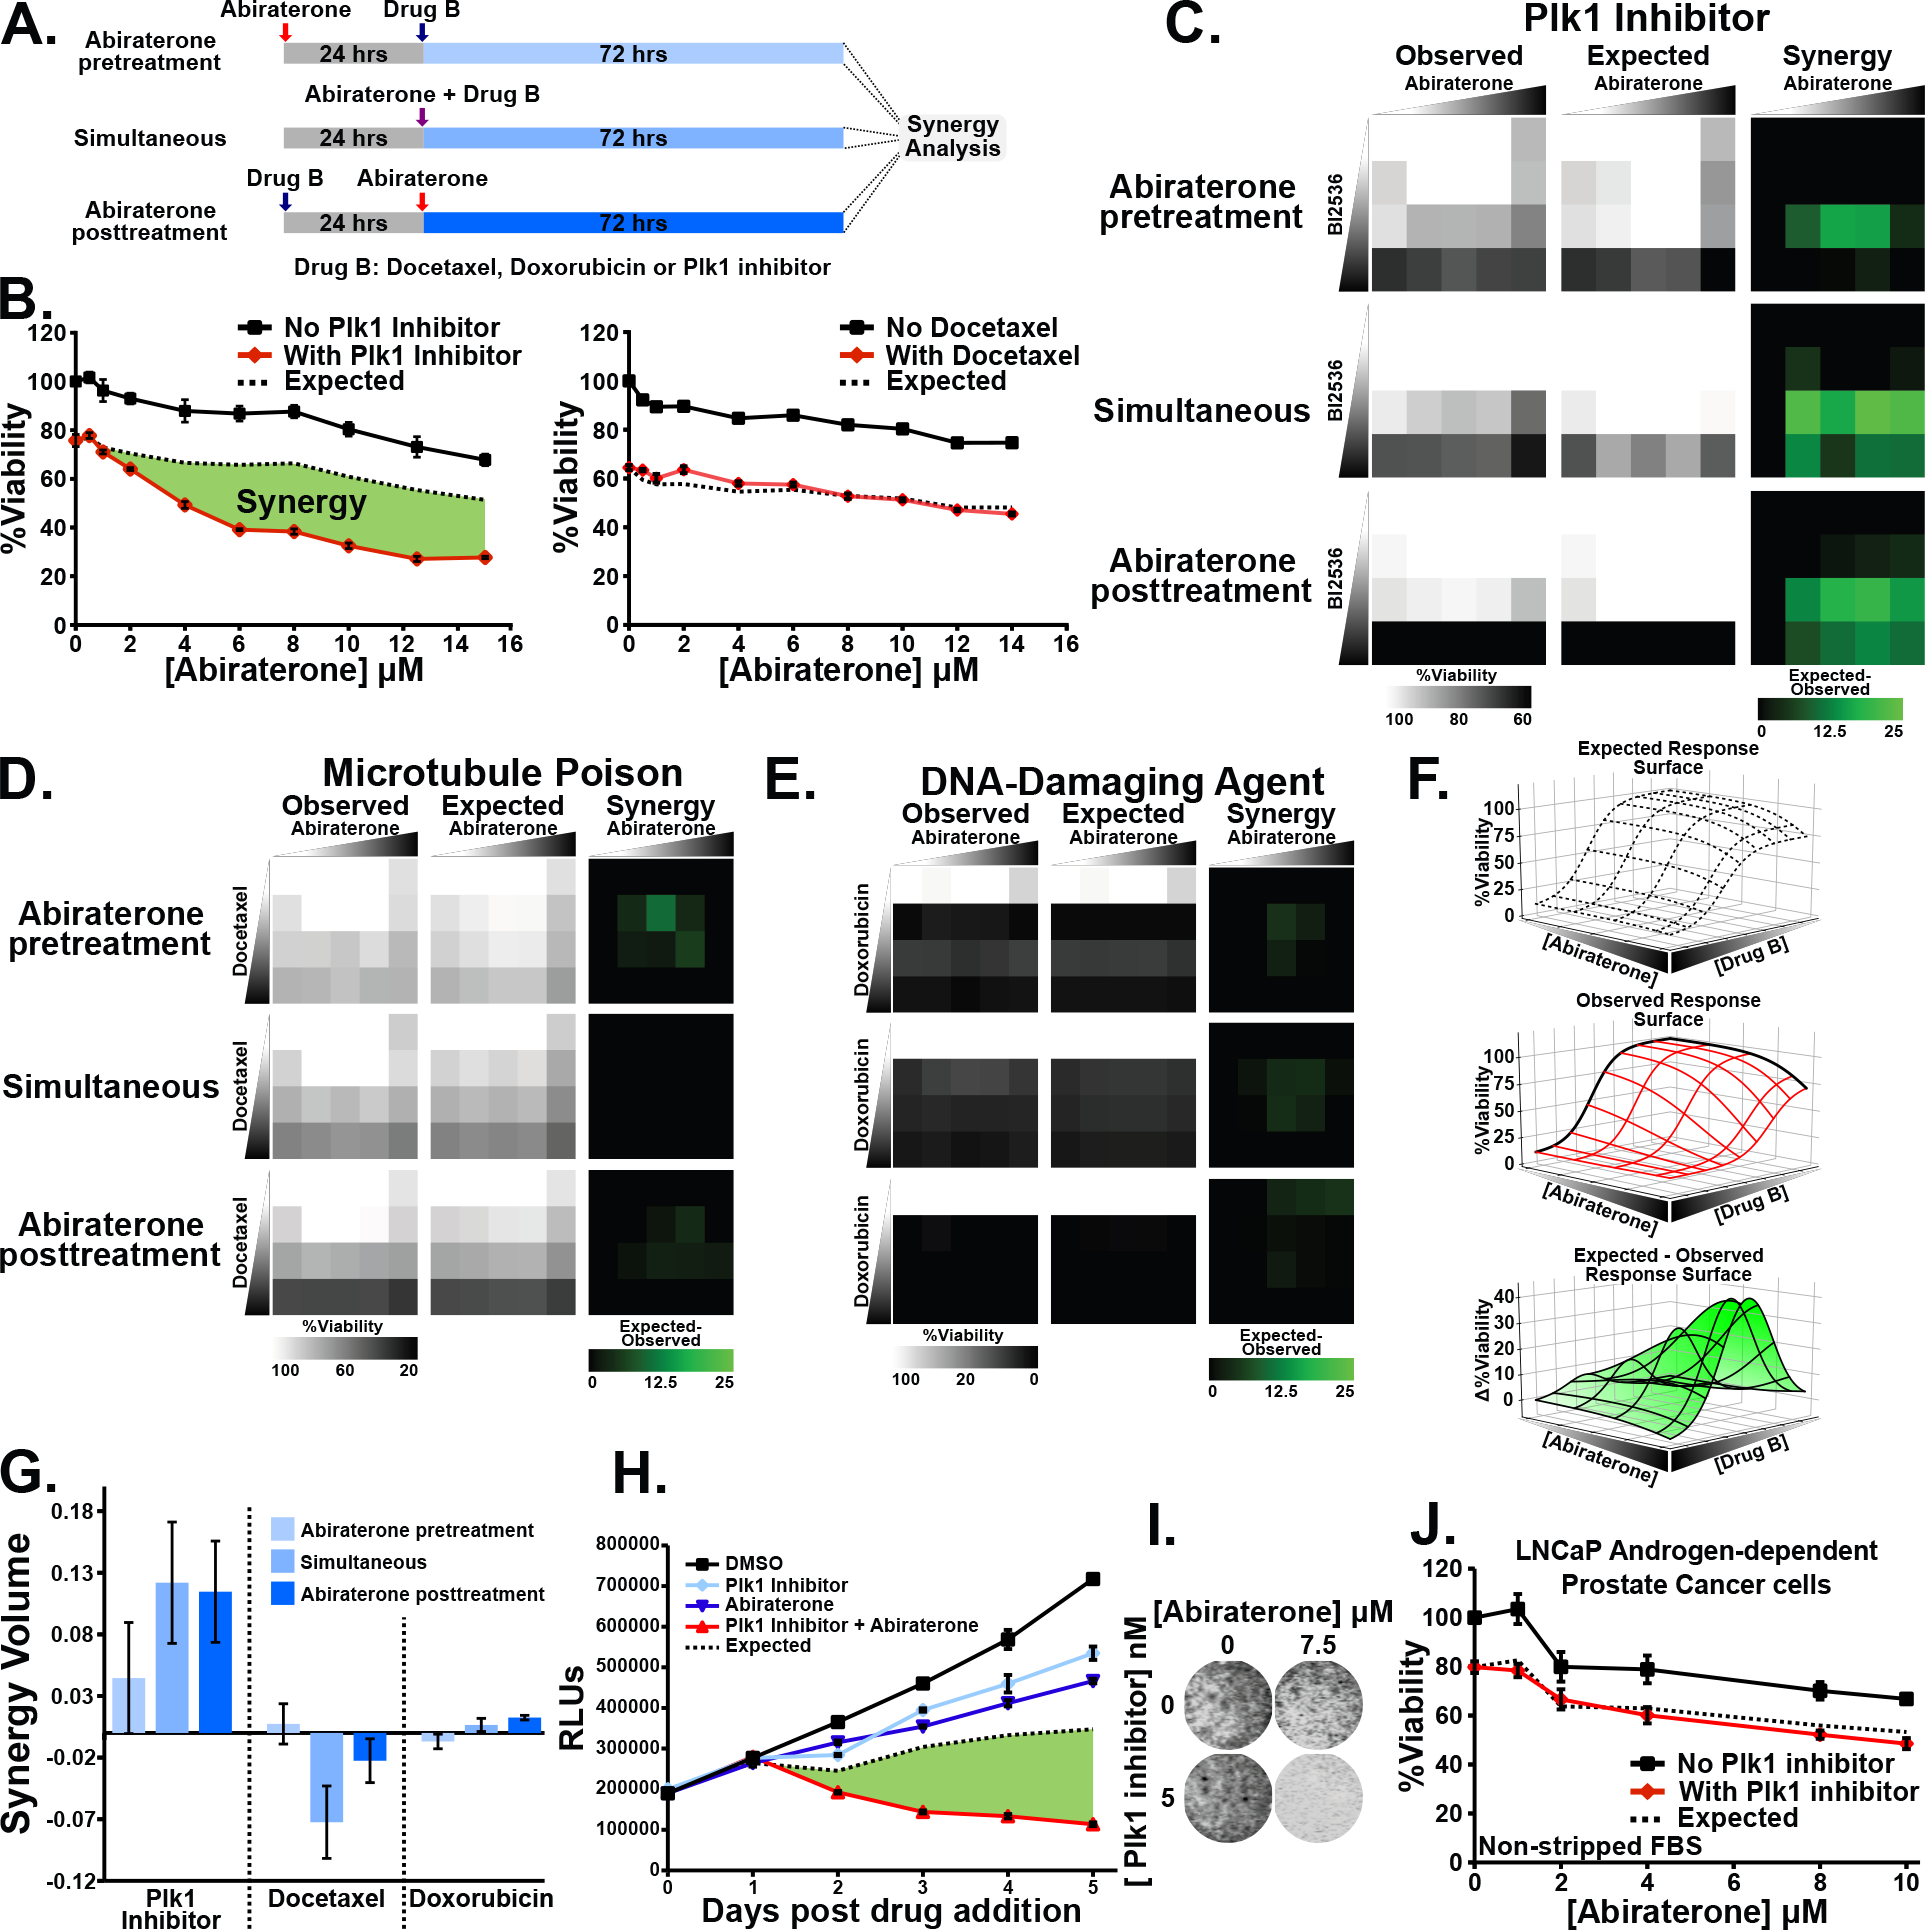
Figure 1. The combination of Plk1 inhibitors and abiraterone synergistically kill CRPC cells.

(A) Schematic indicating abiraterone-based synergy analysis in a time-staggered and non-staggered manner.
(B) Assessing synergy between abiraterone and a Plk1 inhibitor BI2536 (4 nM) or docetaxel (5 nM). C4-2 CRPC cells growing in media containing csFBS were subjected to abiraterone in the absence (black line) or presence (red line) of the second drug for 72 hours. The concentration of the second drug was chosen based on a 20–30% decrease in relative viability when used alone. Mean ± SEM (n = 3) is shown. Expected viability (dashed black line) is calculated according to the Bliss independence model of drug additivity. Synergy, depicted by the green area, is a decrease in viability beyond the expected additive effect.
(C-E) C4-2 cells grown using csFBS were subjected to dose matrices of abiraterone (0, 1, 5, 10, and 20 μM) and either BI2536, or docetaxel (0, 1, 10, and 50 nM ), or doxorubicin (0, 1, 10, and 50 μM) as depicted in (A). Observed viability, expected viability, and synergy (expected minus observed) are shown.
(F) Graphical representation of volumetric measurement of synergy. The observed relative viability response matrix is plotted as a dose response surface (middle). Deviation from the expected response surface (top) generates an expected minus observed response surface (bottom). The total synergy present is calculated as the integrated volume beneath the expected minus observed response surface.
(G) Synergy volume measurements calculated as in (F) from dose-response matrices in (C-E). Mean ± SEM (n = 3).
(H) C4-2 cells in media containing csFBS were treated with 5 nM BI2536, 10 μM abiraterone, and the combination. Shown is relative viability, expected viability, and synergy in green. Mean ± SEM (n = 3).
(I) C4-2 cells were grown using csFBS, subjected to the indicated drugs for 72 hours, and confluence assessed by SYTO 60 staining.
(J) LNCaP androgen-dependent cells were grown using non-stripped FBS to assess synergy between BI2536 (5 nM) and abiraterone as in (B).
