
Figure 3. Abiraterone treatment induces an AR-independent synergy-specific gene expression signature dominated by mitosis and mitotic spindle related gene sets.
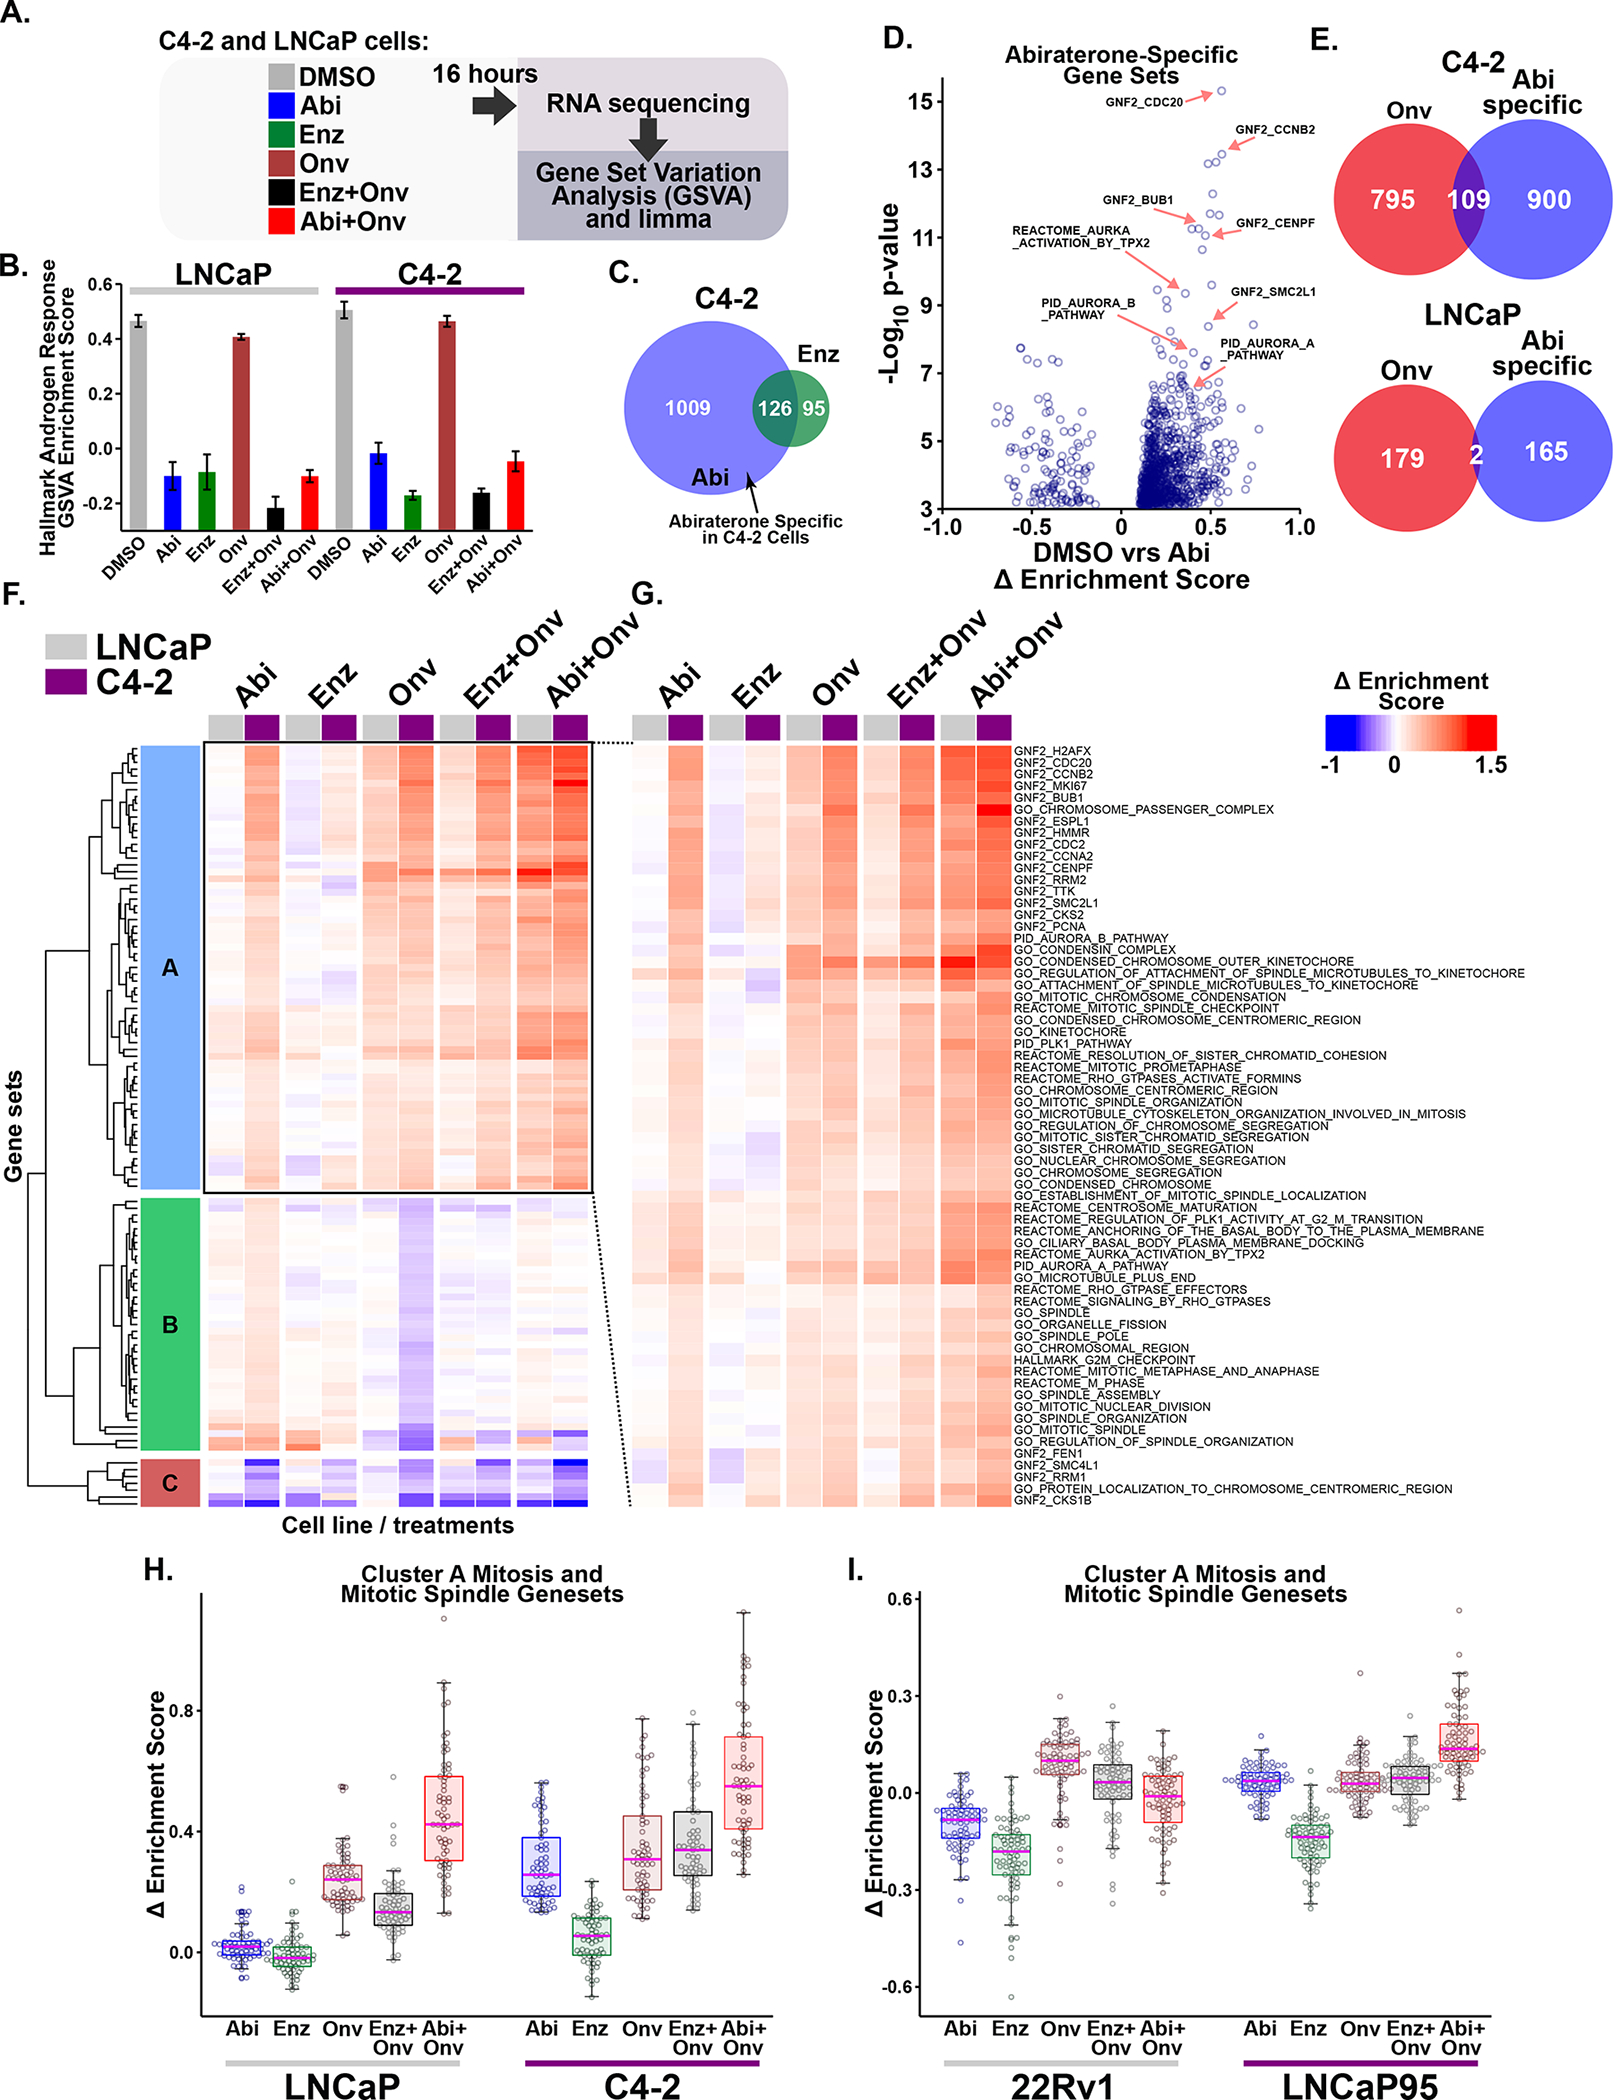
(A) Diagram of the RNA sequencing experiment. C4-2 and LNCaP cells were grown in FBS-containing media, treated for 16 hours with 5 μM abiraterone (Abi), 10 μM enzalutamide (Enz), onvansertib (15 or 30 nM, respectively; Onv), or the indicated combinations.
(B) AR-dependent transcription was investigated using the Hallmark Androgen Response gene set. Bars indicate mean enrichment score ± SEM.
(C) Identification of abiraterone-specific gene sets. Venn diagram depicts overlap of differentially expressed gene sets (FDR ≤ 0.01) in the two conditions.
(D) Volcano plot of abiraterone-specific gene sets in C4-2 cells. The Δ enrichment score represents the difference in mean enrichment scores between drug and control treatment. Several gene sets related to mitosis and the SAC are indicated by red arrows. GNF2 gene sets represent cancer gene neighborhoods (57). Members of these gene sets have expression patterns highly covariant with the seed gene listed in the name.
(E) Venn Diagram comparing abiraterone-specific and onvansertib differential gene set expression (FDR ≤ 0.01). Onvansertib and abiraterone share a large number of significant gene sets in C4-2, but not LNCaP, cells.
(F) Unsupervised hierarchical clustering of Δ enrichment scores using all treatments (columns) and the 109 gene sets (rows) identified in (E) using C4-2 cells. Columns depicting LNCaP and C4-2 gene set expression are marked at the top with grey and purple boxes, respectively. For labelled heatmap see Supplementary Fig. S2C.
(G) Expanded view of cluster A that is induced by abiraterone but not enzalutamide in C4-2 but not LNCaP cells, organized and displayed as in (F). Nearly all of the gene sets in cluster A are related to mitosis or the mitotic spindle.
(H) Box and whisker plot of cluster A gene set expression in C4-2 and LNCaP cells. Boxes depict the median and upper and lower quartiles. Whiskers extend to the most extreme value located less than 1.5 times the interquartile range from the upper or lower quartile. Individual gene sets are overlaid as circles.
(I) RNA sequencing analysis of LNCaP95 and 22Rv1 CPRC cells performed and analyzed as in A-H. Doses used were 10 μM abiraterone, 20 μM enzalutamide, and 15 nM onvansertib for LNCaP95 cells, and 5 μM abiraterone, 10 μM enzalutamide, and 20 nM onvansertib for 22Rv1 cells. The 109 gene set signature was isolated and Δ enrichment scores were hierarchically clustered (Supplementary Fig. S3B). Shown is a box and whisker plot of gene sets contained in cluster A, which contains many gene sets related to mitosis and the mitotic spindle.