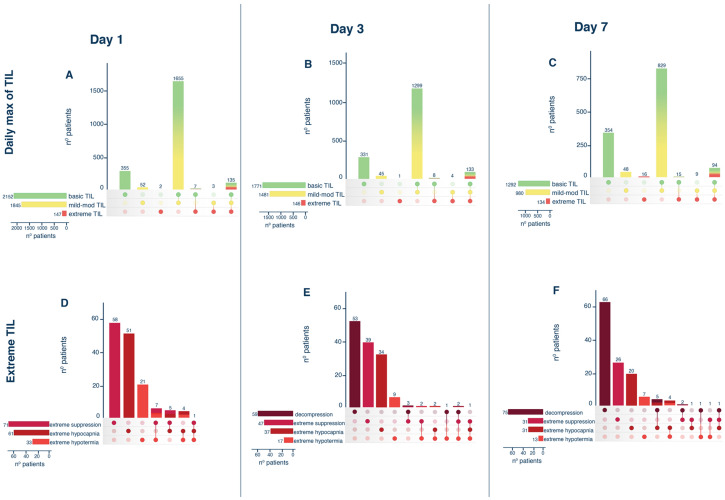
Fig. 1.
The use of TILs adopted (panel A, B, C) and the specific extreme treatment (panel D, E, F) in patients with acute brain injury at days 1, 3, and 7. In each plot, the left horizontal bars represent the numbers of patients that are treated with the specific level of TIL (panel A, B, C) or the specific eTIL (panel D, E, F); the vertical bars represent the number of subjects that received each specific combination of treatment specified by the filled dots. For instance, in panel A referring to day 1, 2152 (355 + 1655 + 7 + 135) patients received a basic TIL (horizontal green bar), among which 355 patients were treated only with basic TIL, 1665 were treated with basic and mild-moderate TIL, 7 with basic and extreme TIL and 135 were treated with basic, mild-moderate and extreme TIL on day 1 (vertical bars). Abbreviations: TIL therapy intensity level

