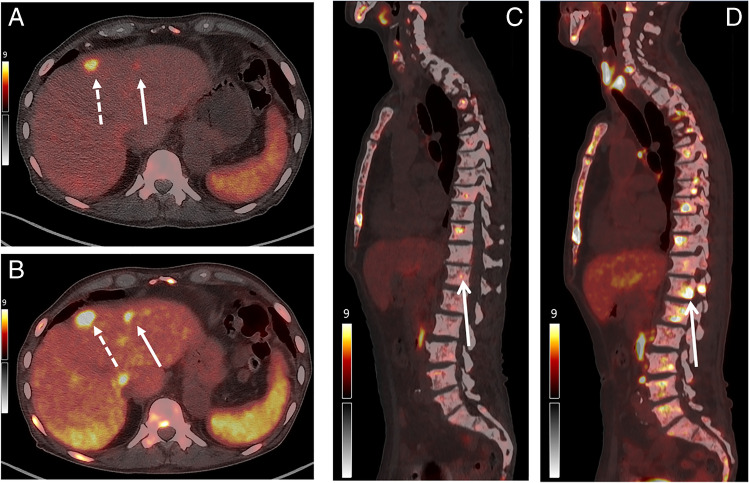
Fig. 1.
Example images for a patient with mismatch lesions. A and C show the [68 Ga]Ga-PSMA-11 PET/CT performed at 1 h p.i. and B and D the additional PET/CT 1 h following additional administration of FDG. Although the lesion shown by the broken arrow demonstrates increased uptake at second imaging, the hepatic lesion shown by the solid white arrow in A and the example bone lesion in C show intense FDG uptake at the second PET/CT (B and D) which is indicative of low PSMA expression and high FDG avidity

