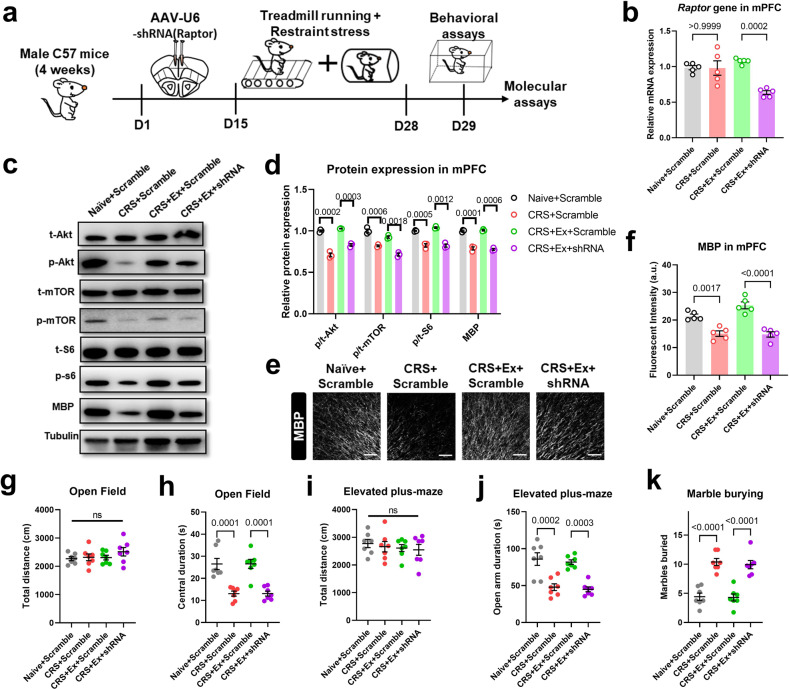
Fig. 3. Brain mTOR pathway mediates exercise effect on anxiety and myelination.
a Schematic illustration for experimental designs of mPFC-specific mTOR inhibition. b Relative mRNA expression of the Raptor gene showed the effective knockdown by shRNA. One-way ANOVA, F(3,16) = 12.48, P = 0.0002. N = 5 mice per group. Tukey’s post-hoc test was used for comparisons between the two groups. c Representative Western blotting bands for mTOR proteins and MBP expression in PFC extracts. d Quantification of relative protein expression showed the suppression of p-Akt, p-mTOR, p-S6, and MBP proteins when the Raptor gene was knocked down in mPFC. Multiple t-test was used for comparisons between the two groups. N = 3 mice per group. e Fluorescent images of MBP in the mPFC region showed the demyelination under Raptor gene knockdown. Scale bar, 100 μm. f Fluorescent intensity (in a.u.) of MBP was decreased after Raptor gene knockdown. One-way ANOVA, F(3,16) = 26.84, P < 0.0001. N = 5 mice per group. Tukey’s post-hoc test was used for comparisons between the two groups. g Total distance traveled in the open field was unaffected under Raptor gene knockdown. One-way ANOVA, F(3,24) = 1.002, P = 0.4090. h Time spent in the central region in the open field was decreased under Raptor gene knockdown. One-way ANOVA, F(3,24) = 18.47, P < 0.0001. i The locomotor activity on the elevated plus maze was unaffected in CRS + Ex+shRNA group. One-way ANOVA, F(3,24) = 0.3355, P = 0.7998. j Time duration in the open arm on the elevated plus maze was decreased in CRS + Ex+shRNA group. One-way ANOVA, F(3,24) = 16.48, P < 0.0001. k The number of marbles buried was increased by suppressing Raptor gene expression. One-way ANOVA, F(3,24) = 27.90, P < 0.0001. N = 7 mice in each group in (g–k). Tukey’s post-hoc test was used for comparisons between the two groups. All data were presented as mean ± sem.

