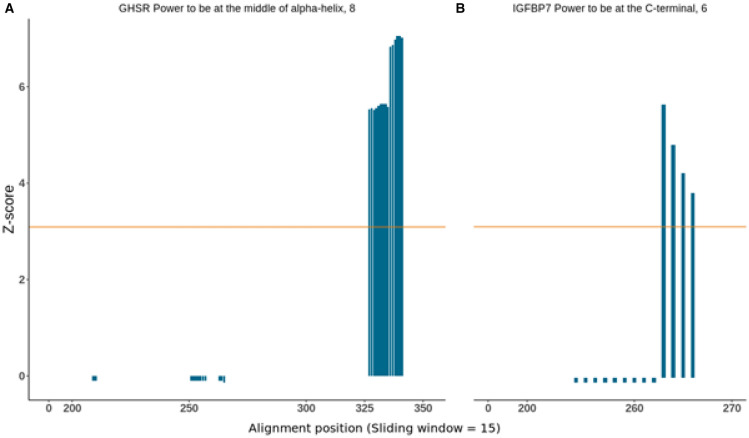
Figure 3.
Detection of significant physicochemical amino acid changes using TreeSAAP and genes trees. This analysis was performed on the genes that presented higher ω values identified by codeML analysis in giant cetaceans. Only GHSR (A) and IGFBP7 (B) showed significant results. A highly significant z-score (z > 3.09, p < 0.01), represented here by the regions above the orange line, indicates more non-synonymous substitutions than assumed under the neutral model and therefore are interpreted as a result of positive selection. Respective property and category are shown above the graphs.

