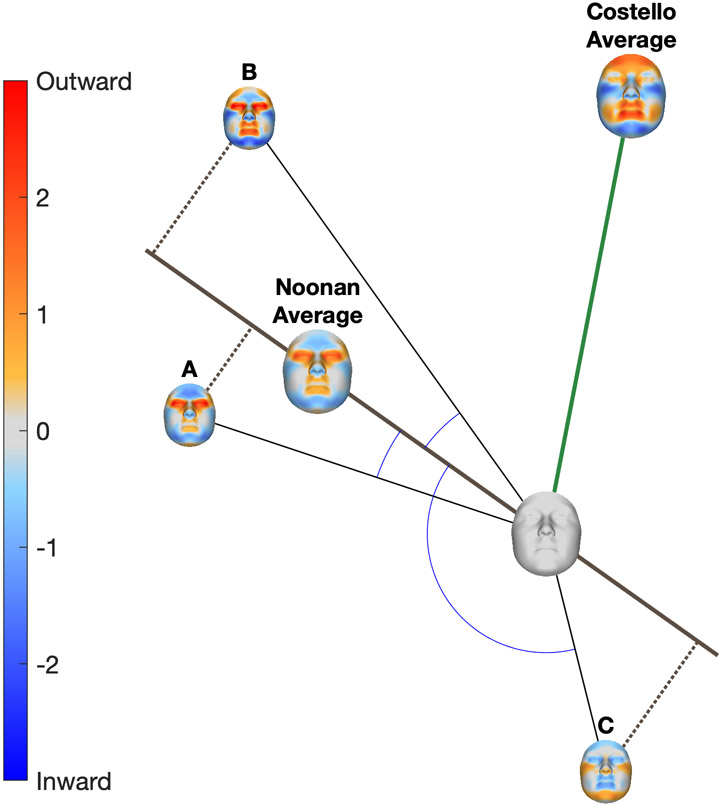
Figure 2.
Description of cosine distance and severity measures. Each patient (A, B and C) is represented by their facial signature. The facial signature is shown graphically as a colour-coded map where red indicates the point on the face of the patient is displaced outwardly relative to normal and blue indicates it is displaced inwardly. The average signatures of all patients with Noonan syndrome and all patients with Costello syndrome are shown by the larger colour maps. Geometrically, each signature can be interpreted as a vector. Anatomically each signature can be interpreted as a particular transformation of facial shape away from average (blank signature), for example, eyes widening (red) in combination with a shrinking (blue) chin. Similarity, in terms of what parts of the face are affected in what ways is measured by the angle between two vectors. For example, patients A and B have small angles (low cosine distance) to the Noonan phenotype, indicating they are affected in a way that is characteristic of Noonan syndrome.

