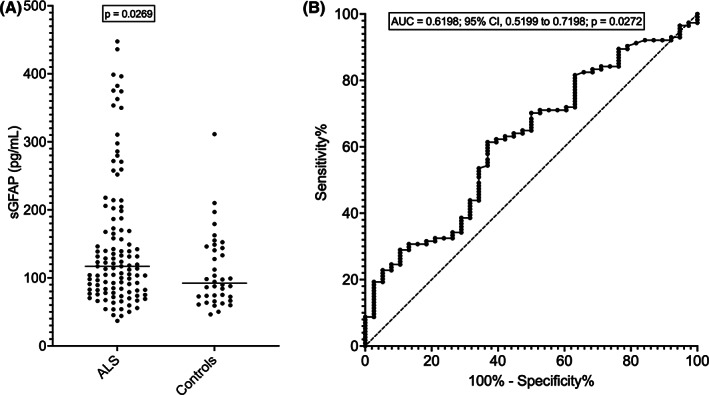
Figure 2.

sGFAP levels in ALS and controls. (A) sGFAP levels in patients with ALS and neurologically healthy controls. The horizontal bars represent median values. (B) ROC curve of sGFAP for the discrimination between ALS patients and controls. ALS, amyotrophic lateral sclerosis; AUC, area under the ROC curve; ROC, receiver operating characteristics; sGFAP, serum glial fibrillary acidic protein.
