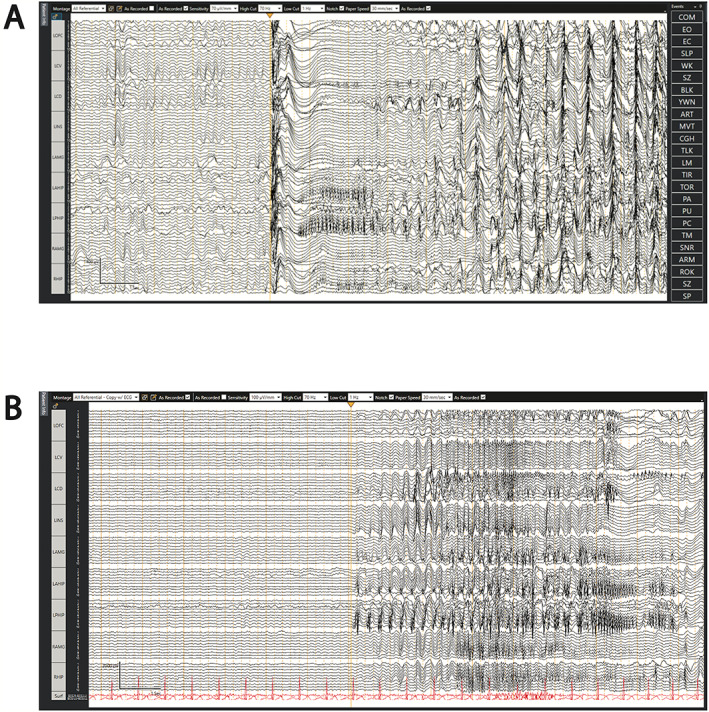
Figure 1.

SEEG recordings showing example ictal onsets. (A) Ictal onset showing herald spike that is wide‐field on the left side marked by yellow arrow. This is followed by low‐voltage, high‐frequency activity within the left hippocampus and amygdala, which is followed again by wide‐field, rhythmic activity. (B) Example of limbic origin seizure with periodic high‐voltage spikes and sharps in the hippocampus and amygdala marked by the yellow arrow that become rhythmic periodic discharges.
