Fig. 2.
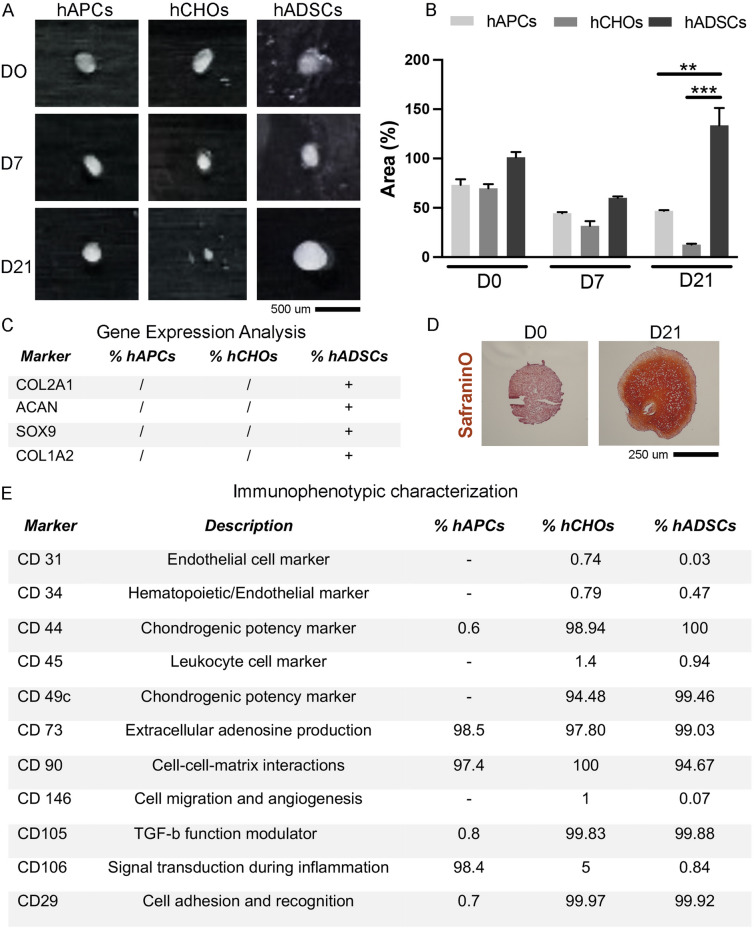
Chondrogenic comparison of hAPCs, hCHOs and hADSCs cell lines. Pellet cultures were generated from the three different cell lines isolated obtained from the same patient (n = 3 patients), and analyses performed at 3 different time points of chondrogenic differentiation (day 0-DO, day 7-D7, day21-D21). A Morphological comparison of pellet culture: representative macroscopic images of pellets generated with the 3 different cell types. B The graph shows the quantification of the individual areas of the samples generated with the 3 cell types expressed as percentage (%) normalized to hADSCs at day 0. C Chondrogenic gene expression analysis calculated among three biological replicates. The / and + indicate the absence or presence of detectable ct levels of the gene of interest: Collagen type 2A1 (COL2A1), Aggrecan (ACAN), Sox9 (SOX9) and Collagen type 1A2 (COL1A2) markers in RT-qPCR assay. GAPDH was used as the housekeeping gene and data were normalized against hADSCs at day 21. D Histological analysis on 10 µm cryosections stained with SafraninO to detect accumulation of GAG in the ECM. Representative brightfield images from hADSCs pellet at day 0 (D0) and day 21 (D21) of chondrogenic differentiation. E Immunophenotypic characterization: the table shows the cytofluorimetric analyses of the stemness markers used to characterize the three different cell lines harvested from the tissues belonging to the same donor knee. The most representative patient’s analysis is reported here (n = 3). hAPCs human articular progenitor cells, hCHOs human mature chondrocytes, hADSCs human adipose-derived stem cells

