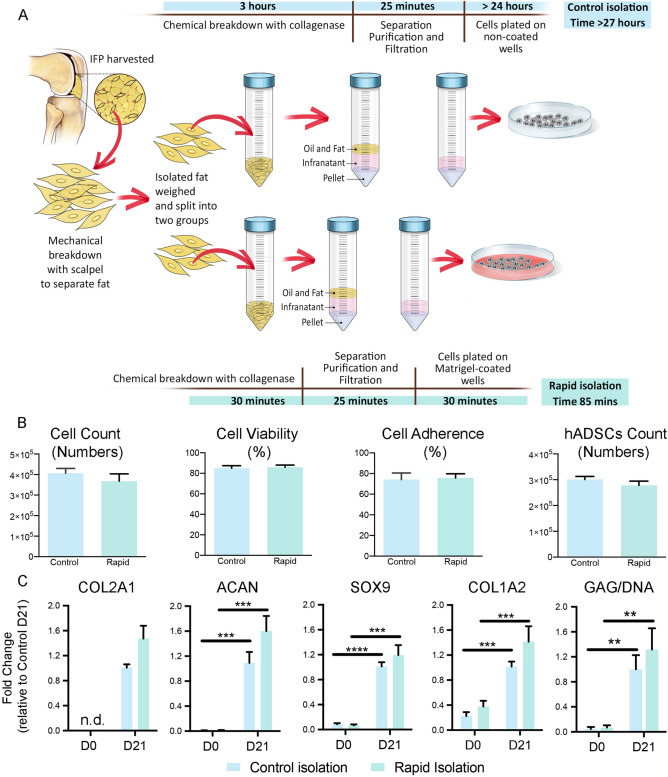
Fig. 3.
Rapid isolation procedure of hADSCs. A Graphical representation of the two protocols tested for hADSCs isolation. B The bar graphs represent the evaluation of cell retrieval ability divided per number of cells isolated (Cell Count), percentage of viability, percentage of adherence to the plastic and matrigel substrate, and number of hADSCs isolated (hADSCs Count). C Chondrogenic gene expression and Glycosaminoglycan assays: the bar graphs represent the fold changes calculated with 2ΔΔCΤ method of Collagen type 2A1 (COL2A1), Aggrecan (ACAN), Sox9 (SOX9) and Collagen type 1A2 (COL1A2) markers in RT-qPCR assay. n.d. = not detectable. GAPDH was used as the housekeeping gene, and data were normalized to hADSCs at day 21. Glycosaminoglycan (GAG) content measured via the normalisation of GAG over total DNA present in the processed scaffolds. Graph bars represent standard error margin between three biological replicates. The two time points of the analysis (day 0-DO and day 21-D21) are reported in × axes of the graphs. Statistical analysis was performed using an unpaired t-test

