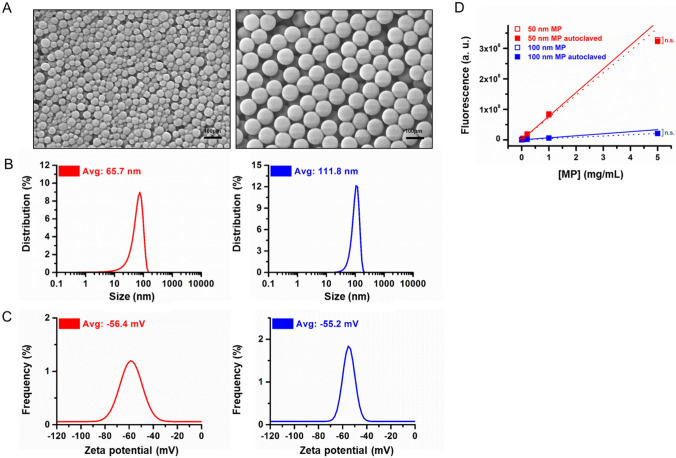
Fig. 1.
Characterization of 50 and 100 nm MPs after autoclaving. A FE-SEM images of 50 (left) and 100 (right) nm MPs. B Size distribution of 50 and 100 nm MPs. C Zeta potential distribution of 50 and 100 nm MPs. D Fluorescence intensities from 50 and 100 nm MPs with increasing concentration. The results are presented as the mean ± S.D. (n = 6)

