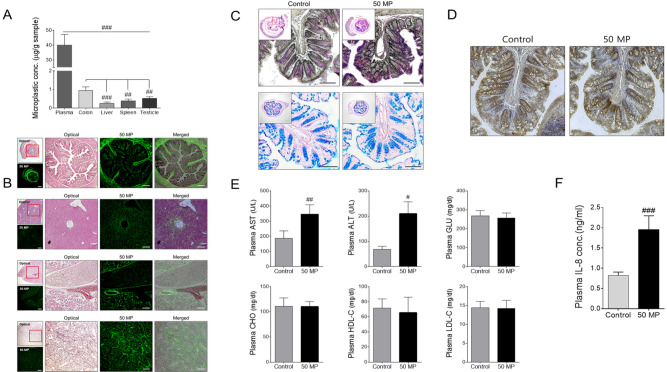
Fig. 5.
Effect of 50 nm MPs on toxicity in C57BL/6 male mice. A Concentration of MPs detected in mouse plasma, colon, liver, spleen and testicles. B Fluorescence of MPs detected in mouse tissue. C PAS and alcian blue staining and D TUNEL staining of 50 nm MPs treated mouse colon tissue. E Plasma AST, ALT, GLU, CHO, HDL-C, and LDL-C concentrations. F Plasma IL-8 concentrations after incubation with 50 nm MPs. The scale bar represents 200 µm. The results are presented as the mean ± S.D. (n = 6). #p < 0.05, ##p < 0.01, ###p < 0.001 vs. control

