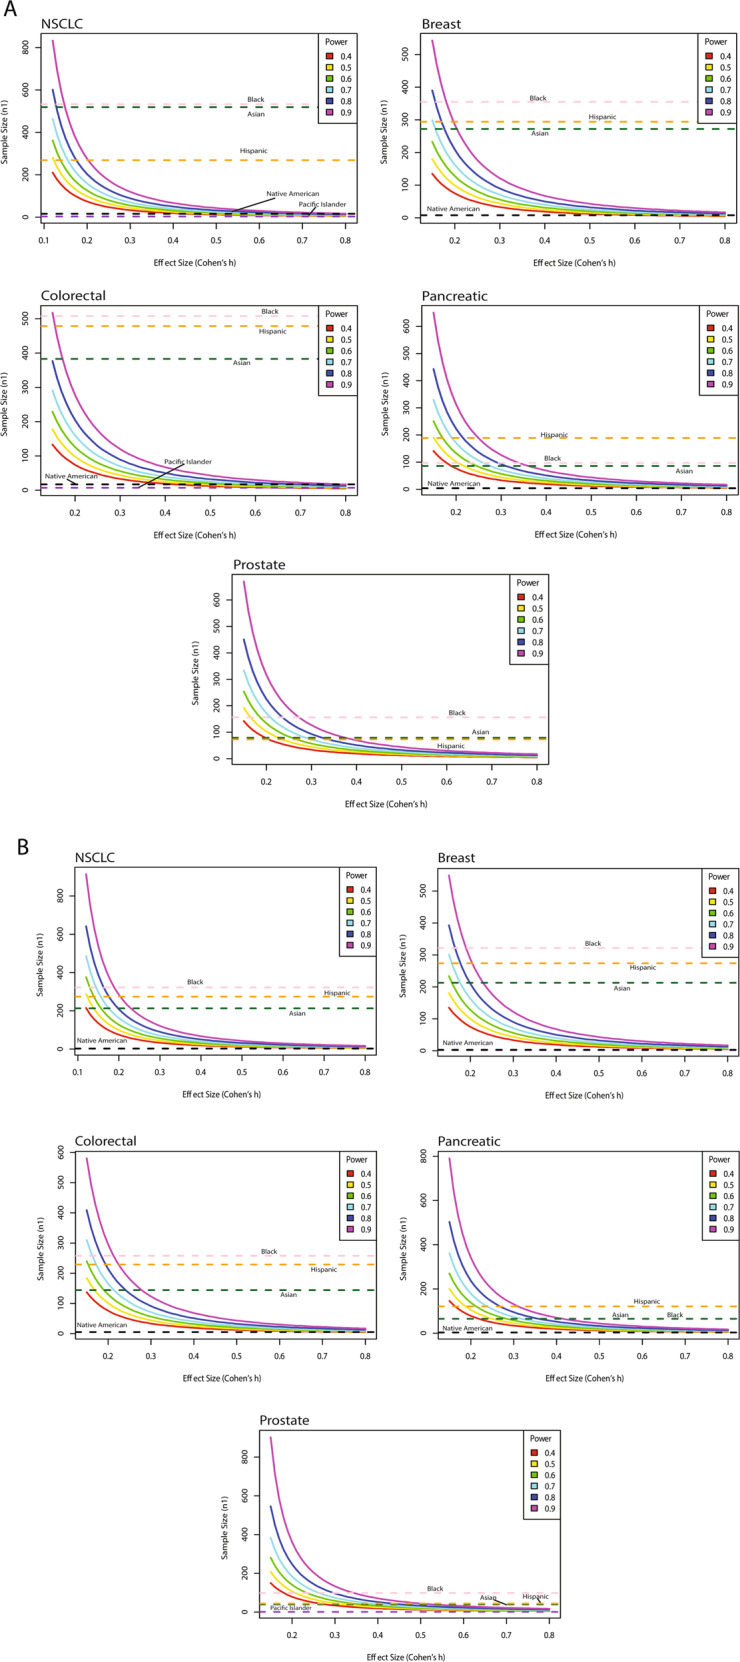
Fig. 2. Sample size estimation to detect differences in mutational proportions between white and racial/ethnic minority patients at varying power increments.

Estimated number of samples (y-axis, n1) required to detect differences in mutational proportions between white and non-white patients at varying statistical power (solid curved lines) for different effect sizes (x-axis). All horizontal dashed lines indicate the current actual number of samples in GENIE for a given racial/ethnic group. Black (dashed pink), Hispanic (dashed orange), Asian (dashed dark green), Native American (dashed black), and Pacific Islander (dashed purple) racial/ethnic groups are displayed. Power = 0.8 is represented by the solid dark blue line. A Primary Cancer. B Metastatic Cancer.
