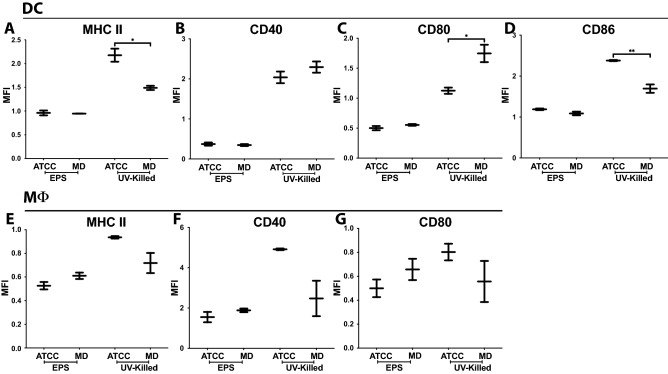
Figure 1.
Bifidobacterium alters DC and MΦ surface phenotype. DC and MΦ cultured with media alone (to which treatment groups are normalized), ATCC25526 (ATCC) or UMB-MBP-01 (MD) UV-killed Bifidobacterium or EPS derived from each strain. After 24 h of culture, cells analyzed by flow cytometry. DC gated on live CD11c + , and MΦ gated on live F4/80 + populations. DC stained for (A) MHC class II, (B) CD40, (C) CD80, and (D) CD86. MΦ stained for (E) MHC class II, (F) CD40 and (G) CD80. MFI: normalized mean fluorescence intensity; MFI values normalized to control and compared using one-way ANOVA. *p value < 0.05; **p value < 0.01. UV-killed MΦ data representative of 3 separate experiments (one of which is shown), 2 wells/culture condition, i.e. 6 total wells per condition over 3 experiments. EPS MΦ data representative of 2 separate experiments (one of which is shown), 2 wells/culture condition, i.e. 4 total wells per condition over 2 experiments. DC data merged from one experiment with EPS treatment and 2 experiments with UV-killed bacteria (one of which is shown), each data set is normalized to its respective “media only” control, i.e. 4 total wells per condition over 2 experiments for UV-killed bacteria and 2 total wells per condition for EPS. The raw files from these experiments are available to download at https://doi.org/10.6084/m9.figshare.21685814.

