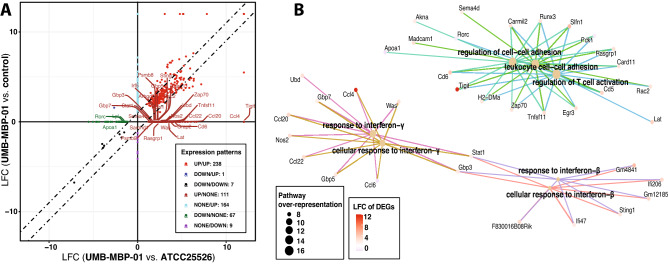
Figure 4.
Transcriptome profiling of intestinal tissues in response to ATCC25526 or UMB-MBP-01. (A) Quadrant plot to show whether differential expressed genes (DEGs) have the same or opposite relationships between each of the pairwise comparison of UMB-MBP-001 vs control and UMB-MBP-001 vs ATCC25526. DEGs were determined using log2 fold change (LFC) > (+ /−)1 and false discovery rate (FDR) < 0.05. (B) Gene-Concept network for most over-represented Gene Ontology (GO) terms to depict over-represented functions based on q-value and gene-count. Over-representation analyses106 of DEGs that are only different abundant in UMB-MBP-001 vs control but not in ATCC25526 vs control, using GO ontologies performed using enrichGO function of clusterProfile Bioconductor package107. For pairwise comparison enrichment analyses for any two conditions, please refer to Supplemental Fig. 4.

