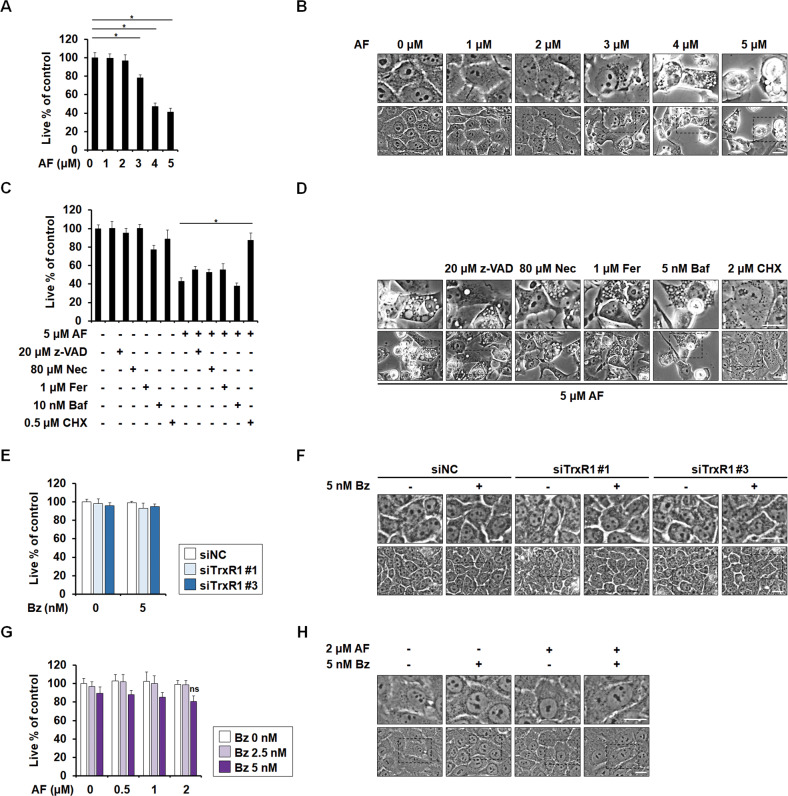
Fig. 3. Non-transformed cells are killed by 4~5 μM AF, but spared by TrxR1 knockdown plus Bz or 2 μM AF plus Bz.
A, B MCF10A cells were treated with the indicated concentrations of AF for 24 h. C, D MCF10A cells pretreated with the indicated doses of z-VAD, Nec, Fer, 3-MA, Baf, or CHX were further treated with AF for 24 h. E, F MCF10A cells transfected with siNC or siTrxR1 for 24 h were further treated with the indicated doses of Bz for 24 h. G, H MCF10A cells were treated with the indicated concentrations of AF and/or Bz for 24 h. A, C, E, G Cellular viability was assessed using IncuCyte, as described in the Materials and Methods. The percentage of live cells was normalized to that of untreated cells (100%). Data represent the means ± SD. (n = 9). One way-ANOVA and Bonferroni’s post hoc test. * p < 0.001; ns (non-significant). B, D, F, H Cellular morphologies were observed by phase-contrast microscopy. Bars, 20 μm.

