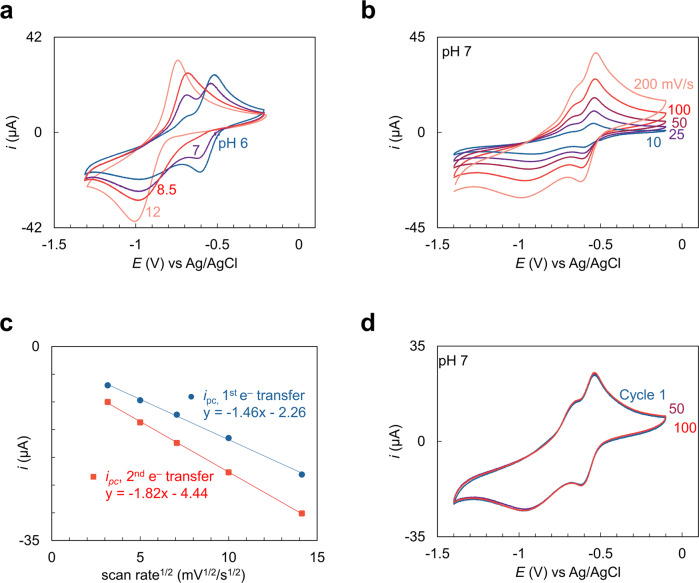
Fig. 2. Cyclic voltammetry of NR in aqueous solutions.
a The cyclic voltammograms of 10 mM NR at pH 6 (blue), 7 (purple), 8.5 (red), and 12 (pastel red) in 1 M NA and 0.1 M LiClO4 solutions under nitrogen with a glassy carbon working electrode, at a scan rate of 50 mV/s. Potentials were recorded versus Ag/AgCl as a reference electrode. b Cyclic voltammograms of NR with scan rates of 10 (blue), 25 (purple), 50 (dark red), 100 (red), and 200 mV/s (pastel red). c Analysis of NR redox reaction of peak current (ipc) versus the square root of scan rate (v1/2) for the first (blue) and second reduction peaks (red). d 100 cyclic voltammograms of NR. Cycle 1: blue, cycle 50: purple, cycle 100: red.

