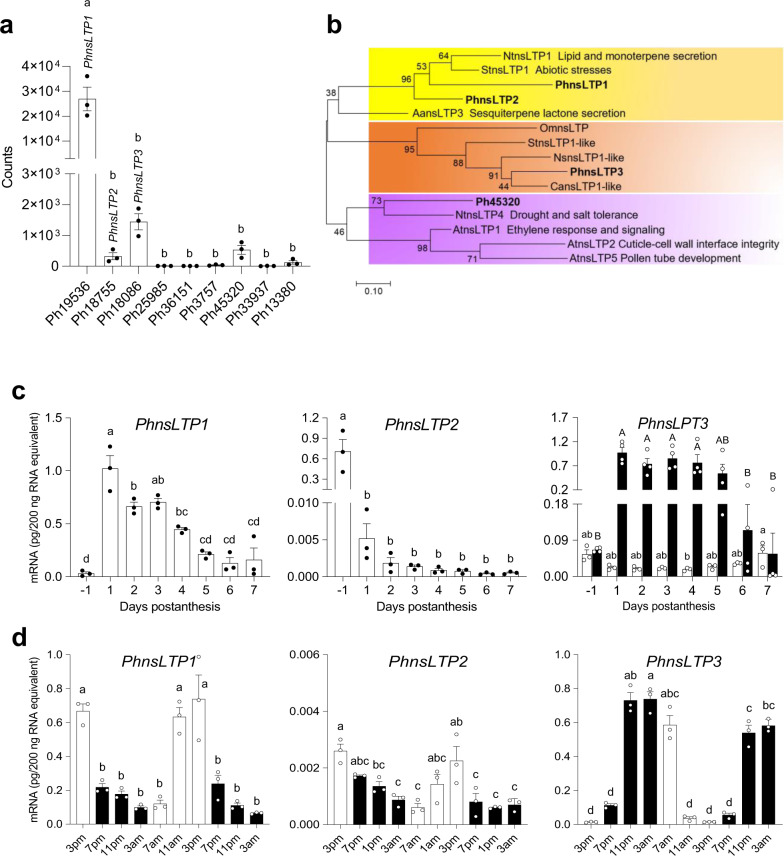
Fig. 1. Expression analysis of petunia nsLTP candidates and phylogenetic analysis of PhnsLTP1, PhnsLTP2, PhnsLTP3, and Ph45320 in type I plant nsLTPs subfamily.
a Expression of nine PhnsLTP candidates in petunia flowers at 20:00 h on day 2 postanthesis. Gene expression was measured based on analysis of RNA-seq datasets19 and represents an average of counts from three biological replicates ± S.E. b The phylogenetic tree was built by the maximum-likelihood method in the MEGA7 package from the alignment of mature proteins using MUSCLE algorithm. At, Arabidopsis thaliana; Nt, Nicotiana tabacum; Aa, Artemisia annua; St, Solanum tuberosum; Ns, Nicotiana sylvestris; Ca, Capsicum annuum; and Om, Oryza meyeriana var. granulate. The scale bar indicates 0.1 amino acid substitutions per site. The percentage of replicate trees in which the associated taxa clustered together in the bootstrap test (1000 replicates) are shown next to the branches. c Developmental expression profiles of PhnsLTP1, PhnsLTP2, and PhnsLTP3 in petunia corollas from bud stage through day 7 postanthesis determined at 15:00 h and at 23:00 h for PhnsLTP3. White columns represent the expression of PhnsLTPs at 15:00 h during flower development, black columns indicate the PhnsLTP3 expression at 23:00 h during flower development. d Changes in PhnsLTPs mRNA levels during a normal light/dark cycle in petunia corollas from day 1 to day 3 postanthesis. White and black columns correspond to light and dark periods, respectively. In c and d absolute mRNA levels were determined by qRT–PCR with gene-specific primers and are shown as pg/200 ng total RNA. Data are means ± S.E. (n = 3 biological replicates in c and d, and n = 4 biological replicates for PhnsLTP3 at 23:00 h in c). Different letters indicate statistically significant differences (P < 0.05) determined by one-way ANOVA with Tukey’s multiple comparisons test. In c, upper-case letters were used to indicate significant differences among PhnsLTP3 mRNA levels at 23:00 h during flower development. The exact P-values are provided in the Source data file.

