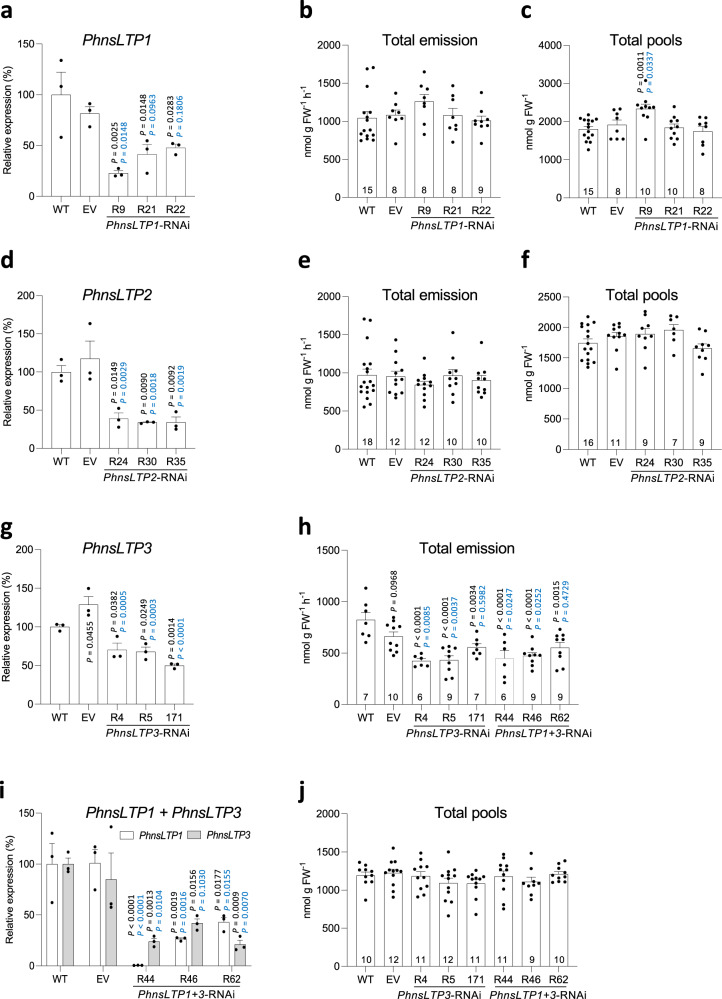
Fig. 3. Effect of PhnsLTP1, PhnsLTP2, PhnsLTP3 and PhnsLTP1 + PhnsLTP3 downregulation on the emission of VOCs and their total pools in petunia flowers.
Transcript levels of PhnsLTP1 (a), PhnsLTP2 (d), PhnsLTP3 (g) and PhnsLTP1 + PhnsLTP3 (i) determined by qRT–PCR with gene-specific primers in 2-day-old wild-type petunia flowers (WT), empty-vector control (EV) and the corresponding three independent transgenic lines with the greatest reduction in gene expression, harvested at 15:00 h. Data are shown as a percentage of a corresponding gene expression in WT set as 100% and are means ± S.E. (n = 3 biological replicates). Total VOC emission (b, e, and h) and total pools (c, f, j) in 2-day-old flowers from WT, EV, and RNAi lines: PhnsLTP1 (b, c), PhnsLTP2 (e, f), PhnsLTP3 and PhnsLTP1 + PhnsLTP3 (h and j). All emission and total pool data are means ± S.E. Numbers at the bottoms of the columns in b, c, e, f, h, and j show the numbers of biological replicates. All P-values were determined by one-way ANOVA with Dunnett’s multiple comparisons test relative to the WT (black) and EV (blue) controls except for i, for which P-values were obtained by two-way ANOVA with Tukey’s multiple comparisons test. FW, fresh weight.

