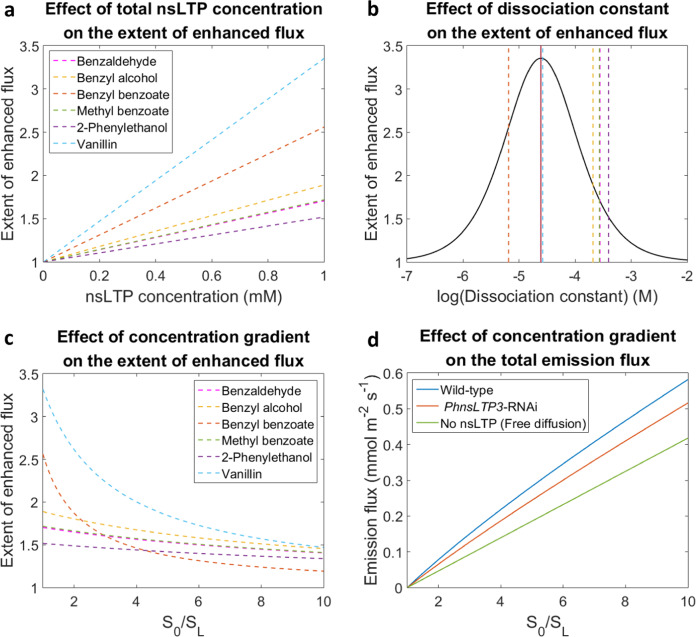
Fig. 6. Mathematical simulations of VOC emission rates as functions of nsLTP abundance, affinity and VOC concentration gradient across the cell wall.
The effect of total nsLTP concentration (a) and dissociation constant (b) on the extent of enhanced flux, and concentration gradient across the cell wall (S0/SL) on the extent of enhanced flux (c) and the total VOC emission flux (d). a The extent of enhanced flux was plotted against different nsLTP levels at a fixed S0/SL ratio and measured respective dissociation constants. b The extent of enhanced flux (black line) was plotted against different dissociation constants at a fixed S0/SL ratio and nsLTP level (1 mM). The vertical red line indicates the predicted optimal dissociation constant, and the six vertical dotted lines show the experimentally obtained in the TNS-binding assay dissociation constants of PhnsLTP3 with benzylbenzoate (orange), vanillin (light blue), benzyl alcohol (yellow), methylbenzoate (green), benzaldehyde (pink), and 2-phenylethanol (purple) from left to right, respectively. c The extent of enhanced flux was plotted against different S0/SL ratios at a fixed nsLTP level (1 mM) and measured respective dissociation constants. d The total emission flux was plotted against different S0/SL ratios assuming nsLTP levels in wild-type 1 mM (blue), in PhnsLTP3-RNAi flowers 0.6 mM (orange), and no nsLTP (green). Abbreviations: S0 and SL are VOC concentrations at the apical facing side of the plasma membrane and the inner side of the cuticle, respectively (see Supplementary Fig. 18). The extent of enhanced flux (E.o.F) in a–c and emission flux (J) in d were calculated based on Eq. 10 and Eq. 9, respectively (see Supplementary Methods). The values of the parameters used are provided in Supplementary Table 6.

