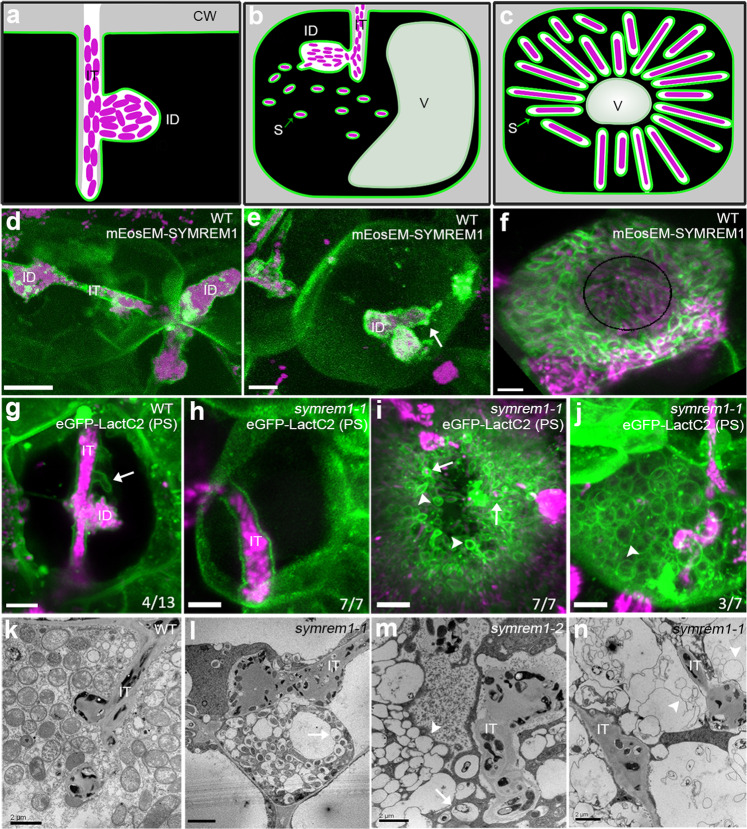
Fig. 1. SYMREM1 stabilizes confined membrane tubes during infection.
a–c Illustrations indicate an infection thread (IT) with an infection droplet (ID; a), symbiosome (S) formation (b) and a symbiosome-filled infected cell (c); CW cell wall, V vacuole. d–f Expression of a mEosEM-SYMREM1 fusion protein (green) specifically labels IT membranes (d), accumulates at bacterial droplet structures (ID) (e), and symbiosome membranes (f). S. meliloti expressing a mCherry marker is shown in magenta. The white arrow (in e) indicates the bacterial release site; the black circle line (in f) indicates the central vacuole. Single focal plane images for maximum projections of z-stacks (d–f) can be found in Supplementary Fig. 1. Experiments were performed with three biological replicates with at least 10 nodules being imaged per replicate. g–j Membranes were visualized by expressing the phosphatidylserine (PS) biosensor LactC2. Spatially confined membrane tubes (arrow) were found on wild-type (WT) IT containing rhizobia (magenta, g) but not on ITs in symrem1 mutants (h). Symbiosome membranes are loosely associated with released rhizobia (arrows, i) or appear as empty spheres (arrowheads, i and j) in symrem1 mutants. Data were collected based on three biological replicates. Images (d–j) were taken as z-stacks (internal distance is 0.5 μm) and shown as 3D projections generated by using Imaris. These patterns were confirmed by transmission electron microscopy for WT (k) and symrem1 mutants (l–n). Scale bars indicate 5 μm (d–j) and 2 μm (k–n). IT infection thread, ID infection droplet. The sketches (a–c) were drawn with Inkscape.

