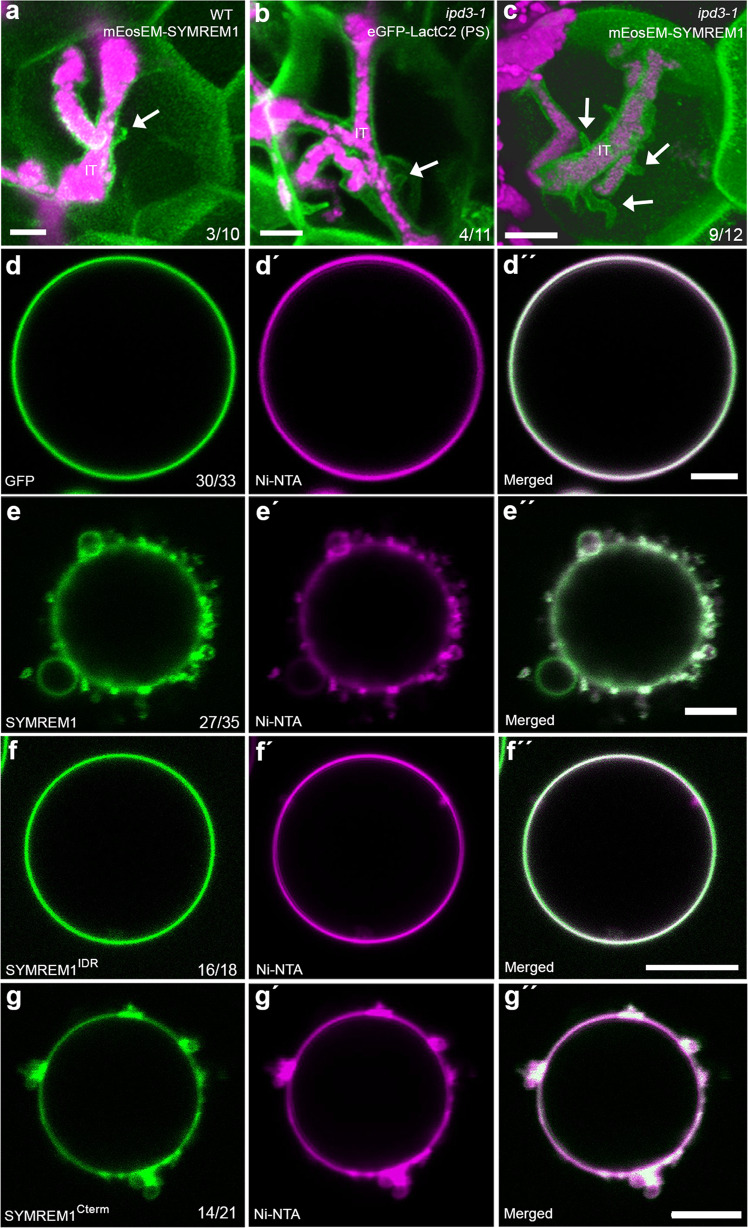
Fig. 3. SYMREM1 can induce membrane morphology changes.
a–c Membrane tubes were found on nodular ITs in the ipd3-1 mutant (arrow, b), while ectopic expression of SYMREM1 greatly increased these tubular outgrowths in the ipd3-1 mutant (arrows, c) but not on WT (arrow, a). Membranes were visualized by expressing mEosEM-SYMREM1 (a, c) or the phosphatidylserine (PS) biosensor LactC2 (b), both shown in green. IT infection thread. S. meliloti expressing a mCherry marker is shown in magenta. Data were collected based on three biological replicates. All images were taken as z-stacks (internal distance is 0.5 μm) and are shown as 3D projection generated by using Imaris. d–g Application of His-tagged GFP (control, green) did not alter the morphology of Ni-NTA containing GUVs (Atto 647N-DOPE was used as membrane marker; magenta) (d–d”). By contrast, application of His-GFP tagged SYMREM1 (green, e-e”) and His-GFP tagged SYMREM1Cterm (green, g–g”) resulted in dramatically altered topologies with many membrane blebs being formed. This was not observed when applying the His-GFP-tagged SYMREM1IDR variant (green, f–f”). GUV experiments were performed twice and showed similar results. Scale bars indicate 5 μm (a–c) and 10 μm (d–g).

