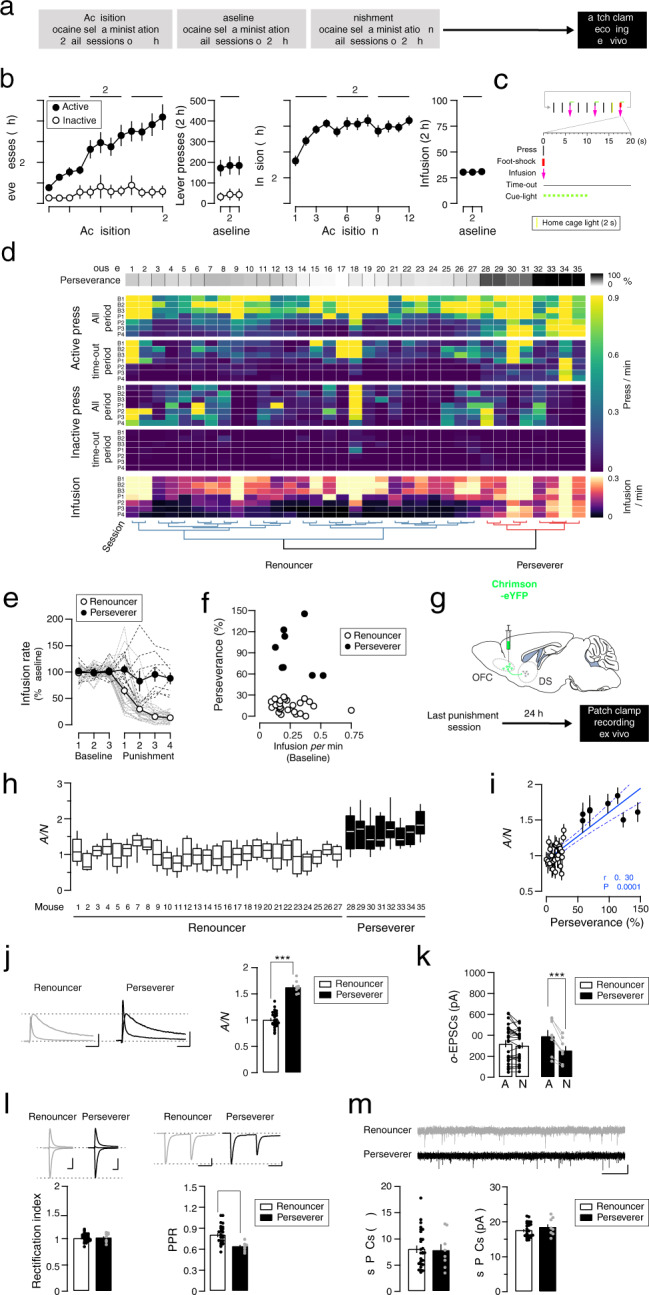
Fig. 1. Potentiation of OFC-DS synapses correlates with perseverance when cocaine self-administration is associated with a risk of foot shock.

a Experiment schedule. b Active and inactive lever presses (left) and infusion (right) during acquisition and baseline sessions of cocaine self-administration (N = 35 mice). c Schedule of punished sessions with foot shock (0.2 mA, 500 ms) every third FR3 completion. d Heat maps showing the behavioral parameter of each mouse during baseline and punished sessions. Clustering was performed with all behavioral parameters of the last two punished sessions and correlated with perseverance. e Rate of cocaine infusions during punished sessions normalized to baseline sessions in renouncers and perseverers (N = 27 and 8 mice respectively). Dashed lines represented individual mouse. f Perseverance as a function of baseline cocaine infusion rate. Each dots represents a mouse. g Slice recordings 24 h after the last punished session in mice infected with Chrimson-eYFP in the OFC. h Box plot of the distribution (median, 25%, 75%, minimal and maximal values) of the ratios of optogentically evoked AMPAR to NMDAR-EPSCs (A/N) recorded at positive potential (+40 mV) from several cells (total of 272 recorded cells/35 mice, with 4–13 cells/mouse) in each renouncing or persevering mice (N = 27 and 8 mice). i Mean AMPAR/NMDAR (A/N) ratio as a function of perseverance, per animal and correlation (Pearson’s r = 0.843, P < 0.001; N = 35 mice). j Example traces (average of 15 sweeps) of AMPAR- and NMDAR-EPSCs recorded at +40 mV. Scale bars, 50 ms, 50 pA. Grouped data for A/N ratio (N = 27 and 8 mice, Mean of 5–13 cells/mouse). Student’s t-test: ***P < 0.001. k Mean amplitude of AMPAR- and NMDAR-EPSCs evoked with optogenetic stimulation (o-EPSCs) of OFC terminals in slices per mouse (N = 27 and 8 mice). Bonferroni post-test ***P < 0.001, for AMPAR vs NMDAR amplitude in perseverers. l Example traces (average of 15 sweeps) of AMPAR-EPSCs recorded at −70, 0 and +40 mV and rectification index in renouncers and perseverers (N = 27 and 8 mice, total of 272 recorded cells/35 mice, Mean of 4–13 cells/mouse). Scale bars, 20 ms, 250 pA. Example traces (average of 3 sweeps) of two successive AMPAR-EPSCs with an inter-pulse interval of 76 ms recorded at -70 mV and paired pulse ratio (PPR) in renouncers and perseverers (N = 27 and 8 mice, total of 292 recorded cells/ 35 mice, Mean of 4–13 cells/mouse). Student’s t-test: *P < 0.05. Scale bars, 50 ms, 200 pA. m Example traces (1 sweep) of spontaneous EPSCs (sEPSCs) recorded at -70 mV. Frequency and amplitude of sEPSCs in renouncers and perseverers (N = 27 and 8 mice, total of 265 recorded cells/35 mice, Mean of 4–13 cells/mouse). Scale bars, 500 ms, 20 pA. Data are expressed as mean ± SEM. FR fixed-ratio, AMPAR α-amino-3-hydroxy-5-methyl-4-isoxazolepropionic acid receptor, NMDAR N-methyl-D-aspartate receptor, EPSC excitatory postsynaptic current, SA self-administration, OFC Orbitofrontal cortex, DS Dorsal Striatum, PPR paired-pulse ratio.
