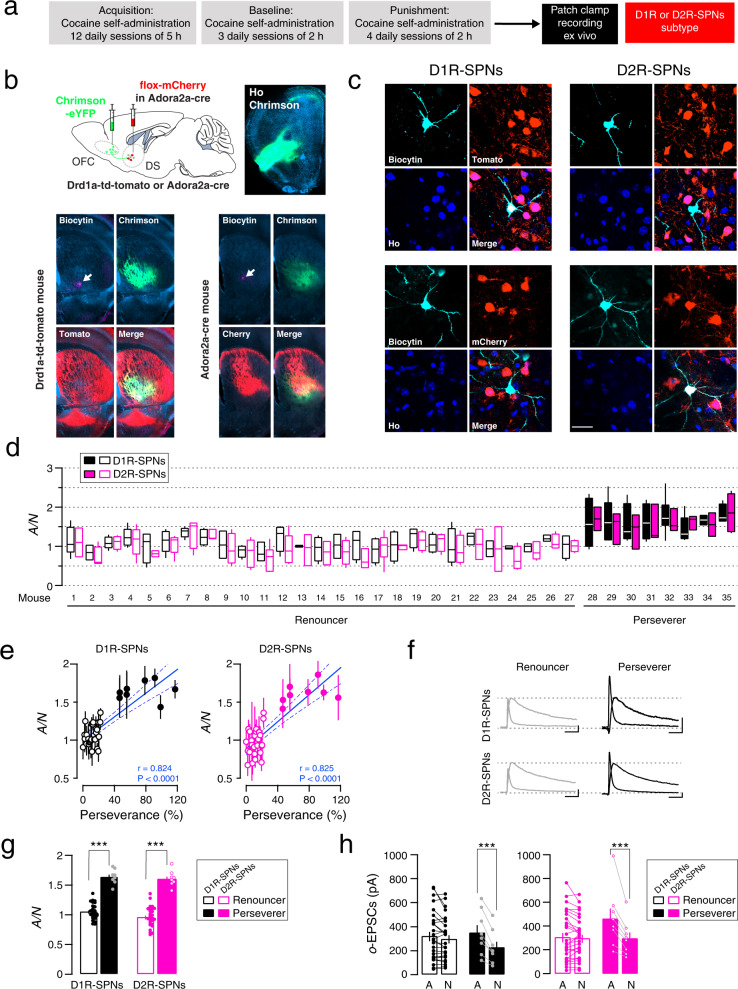
Fig. 2. Cell-type specific synaptic potentiation in compulsion-like mice.
a Experiment schedule. b Post-hoc identification of direct and indirect pathways SPNs. Slice recordings 24 h after the last punished session in mice infected with Chrimson-eYFP in the OFC. SPNs of the DS from BAC Drd1a- td-tomato transgenic mice and Adora2a-cre mice injected with AAV5-Ef1a-DIO-mCherry were filled with biocytin (revelation with streptavidin-Cy5, cyan). c Examples of neurons recorded and filled with biocytin (revelation with streptavidin-Cy5, cyan), considered from the direct pathway (D1R-SPNs) either positive in Drd1a-td-tomato mouse (upper left) or negative in Adora2a-cre/flox-cherry mouse (bottom left). Negative neuron from Drd1a-td-tomato mouse (upper right) or positive neuron in Adora2a-cre/flox-cherry mouse (bottom right), conversely considered from the indirect pathway (D2R-SPNs). Scale bar, 50 µm. d Box plot of the distribution (median, 25%, 75%, minimal and maximal values) of the ratios of optogentically evoked AMPAR to NMDAR-EPSCs (A/N) recorded at positive potential (+40 mV) from D1R- and D2R-SPNs (total of 135 D1R-SPNs and 137 D2R-SPNs/35 mice, with 2–8 identified cells/mouse) in each renouncing or persevering mice (N = 27 and 8 mice respectively). e Mean AMPAR/NMDAR (A/N) ratio as a function of perseverance, per animal and correlation (For D1R-SPNs Pearson’s r = 0.855, P < 0.001; N = 35 mice; For D2RSPNs Pearson’s r = 0.815, P < 0.001; N = 35 mice). f Example traces (average of 15 sweeps) of AMPAR- and NMDAR-EPSCs recorded at +40 mV in D1R-or D2R-SPNs from renouncer and perseverer. Scale bars, 50 ms, 50 pA. g A/N ratio from D1R-or D2R-SPNs of renouncers and perseverers (N = 27 and 8 mice, mean of 2–8 identified cells / mouse). Bonferroni post-test ***P < 0.001 for Renouncers vs Perseverers in D1R-SPNs or D2R-SPNs. h Mean amplitude of AMPAR- and NMDAR-EPSCs evoked with optogenetic stimulation of OFC terminals (o-EPSCs) to D1R-or D2R-SPNs in slices per mouse (N = 27 and 8 mice). Bonferroni post-test **P < 0.01 or ***P < 0.001, for AMPAR vs NMDAR amplitude of perseverers in D1R-and D2R-SPNs, respectively. Data are expressed as mean ± SEM. SPNs Spiny Projection Neurons, Ho Hoechst, OFC Orbitofrontal cortex, DS Dorsal Striatum.

