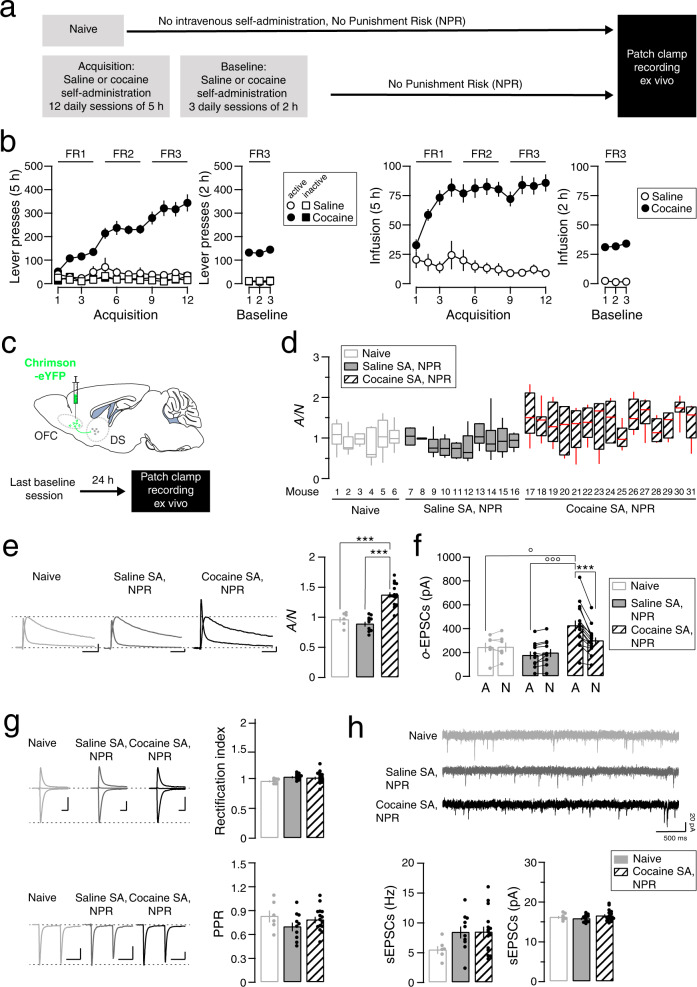
Fig. 3. Synaptic transmission at OFC-DS synapses after acquisition of cocaine SA.
a Experiment schedule. b Active and inactive lever presses (left) and infusion (right) during acquisition and baseline sessions of saline or cocaine self-administration (N = 10 and 15 mice, respectively). c Slice recordings 24 h after the last baseline session in mice infected with Chrimson-eYFP in the OFC. d Box plot of the distribution (median, 25 %, 75 %, minimal and maximal values) of the ratios of optogentically evoked AMPAR to NMDAR-EPSCs (A/N) recorded at positive potential (+40 mV) from several cells (total of 215 recorded cells/31 mice, with 2–10 cells/mouse) in mice that were naive or underwent saline or cocaine SA but did not experience punishment (Saline or Cocaine SA, NPR, N = 6, 10 and 15 mice respectively). e Left, example traces (average of 15 sweeps) of AMPAR- and NMDAR-EPSCs recorded at +40 mV. Scale bars, 50 ms, 50 pA. Right panel, grouped data for A/N ratio (N = 6, 10 and 15 mice, mean of 2–10 cells/mouse). Tukey post-test: ***P < 0.001. f Mean amplitude of AMPAR- and NMDAR-EPSCs evoked with optogenetic stimulation (o-EPSCs) of OFC terminals in slices per mouse (N = 6, 10 and 15 mice). Bonferroni post-test ***P < 0.0001, for AMPAR vs NMDAR amplitude in mice that underwent cocaine SA without punishment session; °P < 0.001, for oAMPAR-EPSCs amplitude from naive vs cocaine SA, NPR; °°°P < 0.001, for oAMPAR-EPSCs amplitude from saline vs cocaine SA, NPR. g Example traces (average of 15 sweeps) of AMPAR-EPSCs recorded at −70, 0, and +40 mV and rectification index in naive mice and mice that underwent cocaine SA (N = 6, 10, and 15 mice, 215 cells from 31 mice, mean of 2–10 cells/mouse). Scale bars, 20 ms, 250 pA. Example traces (average of 3 sweeps) of two successive AMPAR-EPSCs with an inter-pulse interval of 76 ms recorded at −70 mV and paired-pulse ratio (PPR) in naive and saline or cocaine self-administering mice, no punishment risk associated (N = 6, 10 and 15 mice, 268 cells from 31 mice, mean of 3–18 cells/mouse). Scale bars, 50 ms, 200 pA. h Example traces (1 sweep) of spontaneous EPSCs (sEPSCs) were recorded at −70 mV. Frequency and amplitude of sEPSCs in naive and saline or cocaine SA, NPR (N = 6, 10, and 15 mice, 236 cells from 31 mice, mean of 4–12 cells/mouse). Scale bars, 500 ms, 20 pA. Data are expressed as mean ± SEM. NPR, No punishment risk.

