Figure 4.

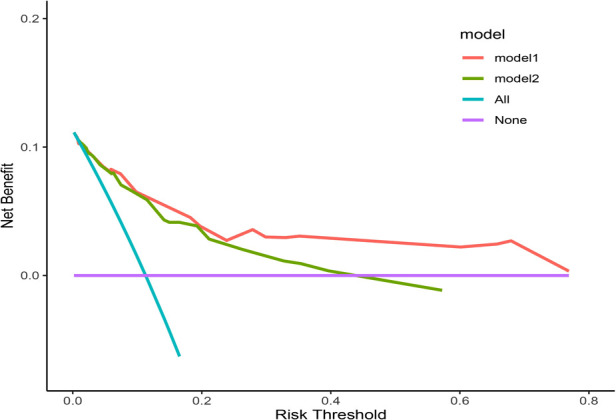
The DCA curve. Model 1 is the nomogram in the study, and Model 2 is the control model, which is composed of variables such as tumor size, histological type, ulcer and invasion depth.

The DCA curve. Model 1 is the nomogram in the study, and Model 2 is the control model, which is composed of variables such as tumor size, histological type, ulcer and invasion depth.