
. 2023 Jan 19;6(1):e1079. doi: 10.1002/hsr2.1079
© 2023 The Authors. Health Science Reports published by Wiley Periodicals LLC.
This is an open access article under the terms of the http://creativecommons.org/licenses/by/4.0/ License, which permits use, distribution and reproduction in any medium, provided the original work is properly cited.
Figure 3.
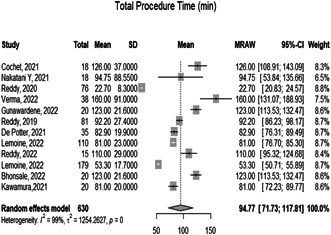
Forest plot diagram of the total procedure time (min)