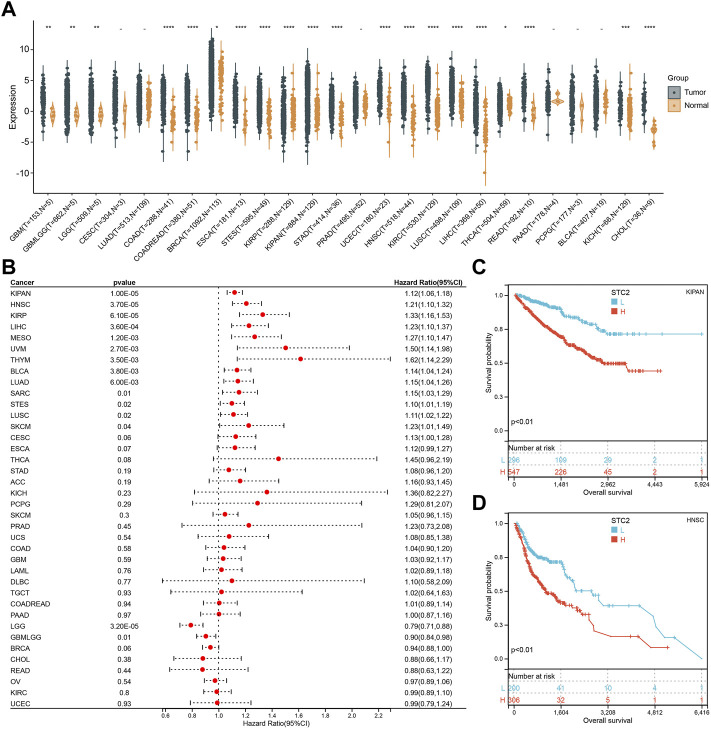
FIGURE 3.
Pan-Cancer Expression Landscape of STC2. (A) STC2 expression across 26 types of human cancer; (B) Cox regression showing the correlation between STC2 expression and OS; (C,D) Two presentative Kaplan-Meier OS curves (KIPAN and HNSC). *: p-value < 0.05; **: p-value < 0.01, ***: p-value < 0.001, ****: p-value < 0.0001.

