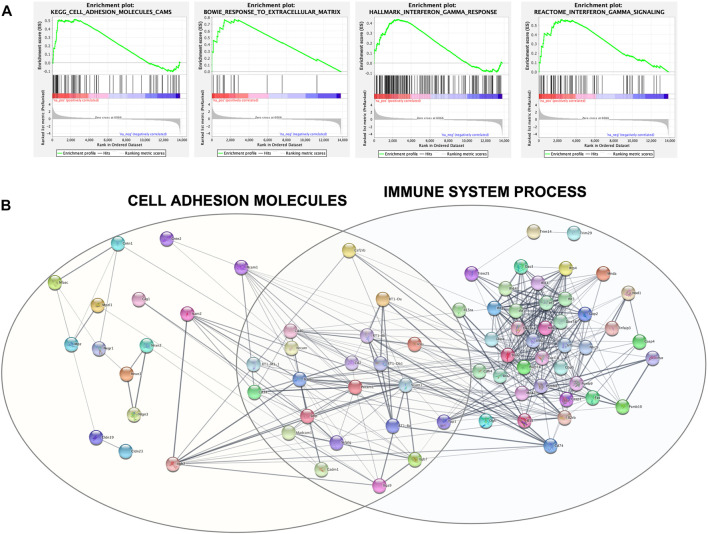
FIGURE 5.
(A) GSEA output of the four mainly enriched gene sets. Each vertical black line corresponds to a gene, and its shift to the left indicates its positive enrichment. (B) Protein–protein interaction network built with Cytoscape and clustered with the STRING functional enrichment network plugin.

