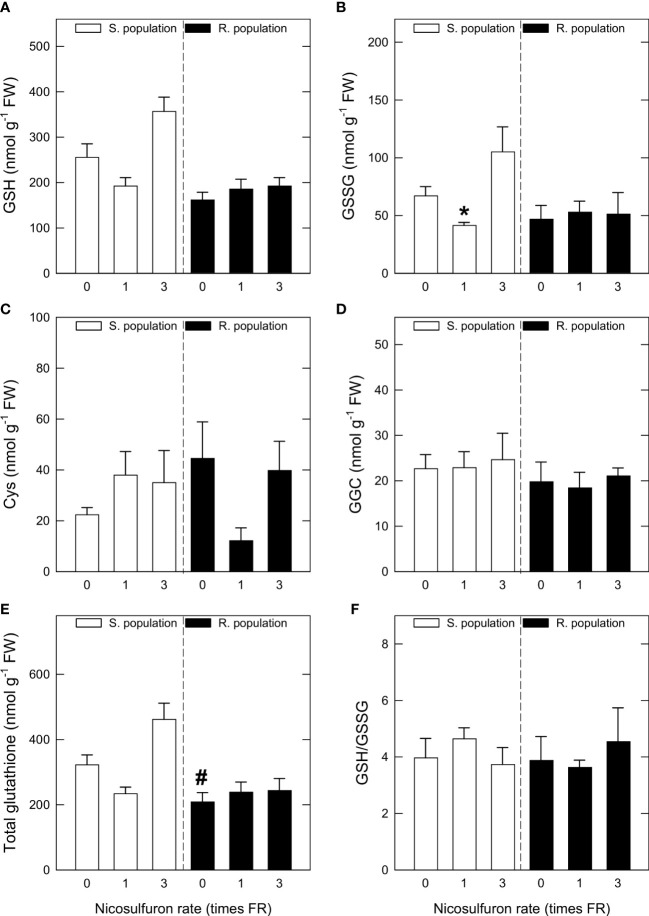
Figure 2.
Reduced glutathione (GSH) content (A), oxidised glutathione (GSSG) content (B), γ-glutamyl-cysteine (GGC) content (C), Cys content (D), sum of GSH and GSSG (total glutathione) contents (E) and GSH to GSSG ratio (F) in Amaranthus palmeri sensitive (S, white) and resistant (R, black) populations treated with different nicosulfuron rates (X axis, times recommended field rate or FR, FR = 0.06 kg ha-1). Mean ± SE (n = 4). Significant differences between untreated S and R plants are highlighted with pound symbols (Student’s t-test, p value ≤ 0.05). For each population, significant differences between treatments and their respective untreated are highlighted with asterisks; (Student’s t-test, p value ≤ 0.05). "#" indicates pound.

