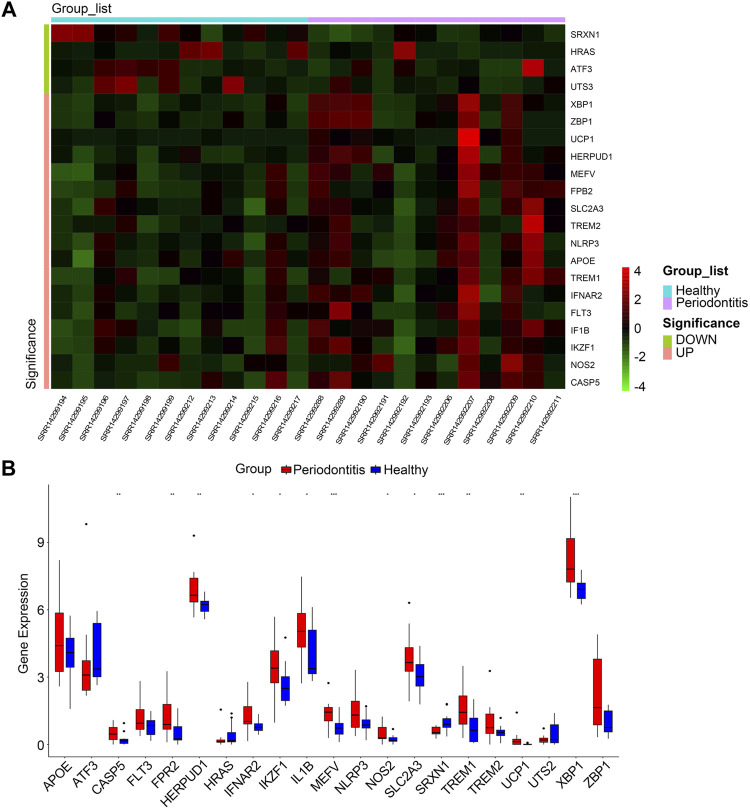
FIGURE 3.
(A) Clustered heatmap of DCDEGs. (B) The bar graph shows the mRNA expression of 21 DCDEGs in GSE173078. Wilcoxon rank-sum test was used to calculate the p-value. Significant difference between the groups, *p < .05, **p < .01, and ***p < .001.

