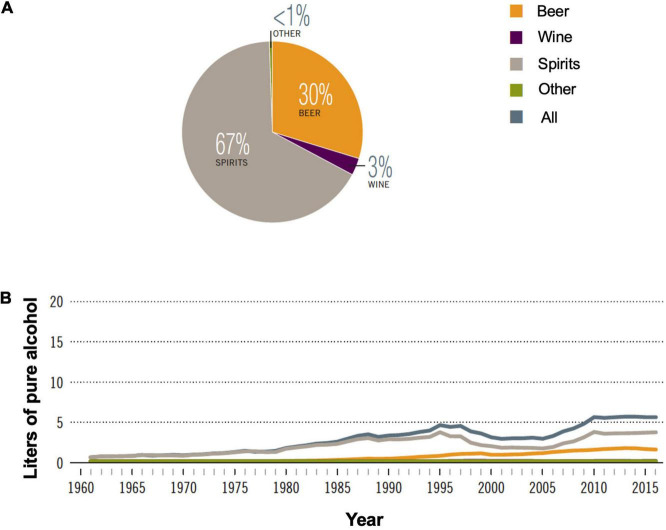
FIGURE 3.
Alcohol consumption in China. (A) Proportion of different alcoholic beverages consumed in 2016; (B) recorded alcohol consumption per capita in adults (age > 15 years), 1961–2016. Adapted with permission from ref (1) under Creative Commons Attribution-Non-Commercial-ShareAlike 3.0 IGO license. (CC BY-NC SA 3.0 IGO; https://creativecommons.org/licenses/by-nc-sa/3.0/igo).

