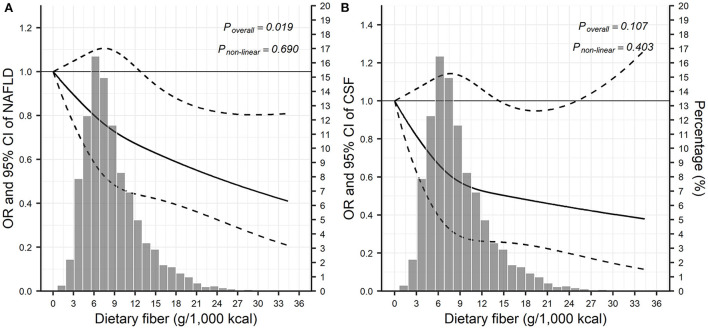
Figure 1.
Visualization of the dose-response relationship between dietary fiber and liver disease based on restricted cubic splinesa. (A) The relationship between dietary fiber and NAFLD; (B) the relationship between dietary fiber and CSF. CI, confidence interval; CSF, clinically significant fibrosis; NAFLD, non-alcoholic fatty liver disease; OR, odds ratio. aModel was adjusted for adjusted for age, sex, smoking, race/ethnicity, education, ratio of family income to poverty, physical activity, total energy, hypertension, and diabetes.

