. 2022 Dec 20;11(1):A0105. doi: 10.5702/massspectrometry.A0105

Fig. 5. Averaged mass spectra per a pixel extracted from (A) tumor region, (B) 10 pmol-BPA spotted tumor region, (C) cerebral cortex region and (D) 50 pmol-BPA spotted cerebral cortex region in the BPA dosed brain tissue section. Inserted figures show the position of spotted BPA and the ROI to extract mass spectra. The relative intensities of the peak at m/z 210.085 to the peak at m/z 209.9 increased after BPA spotting in tumor or cerebral cortex area.
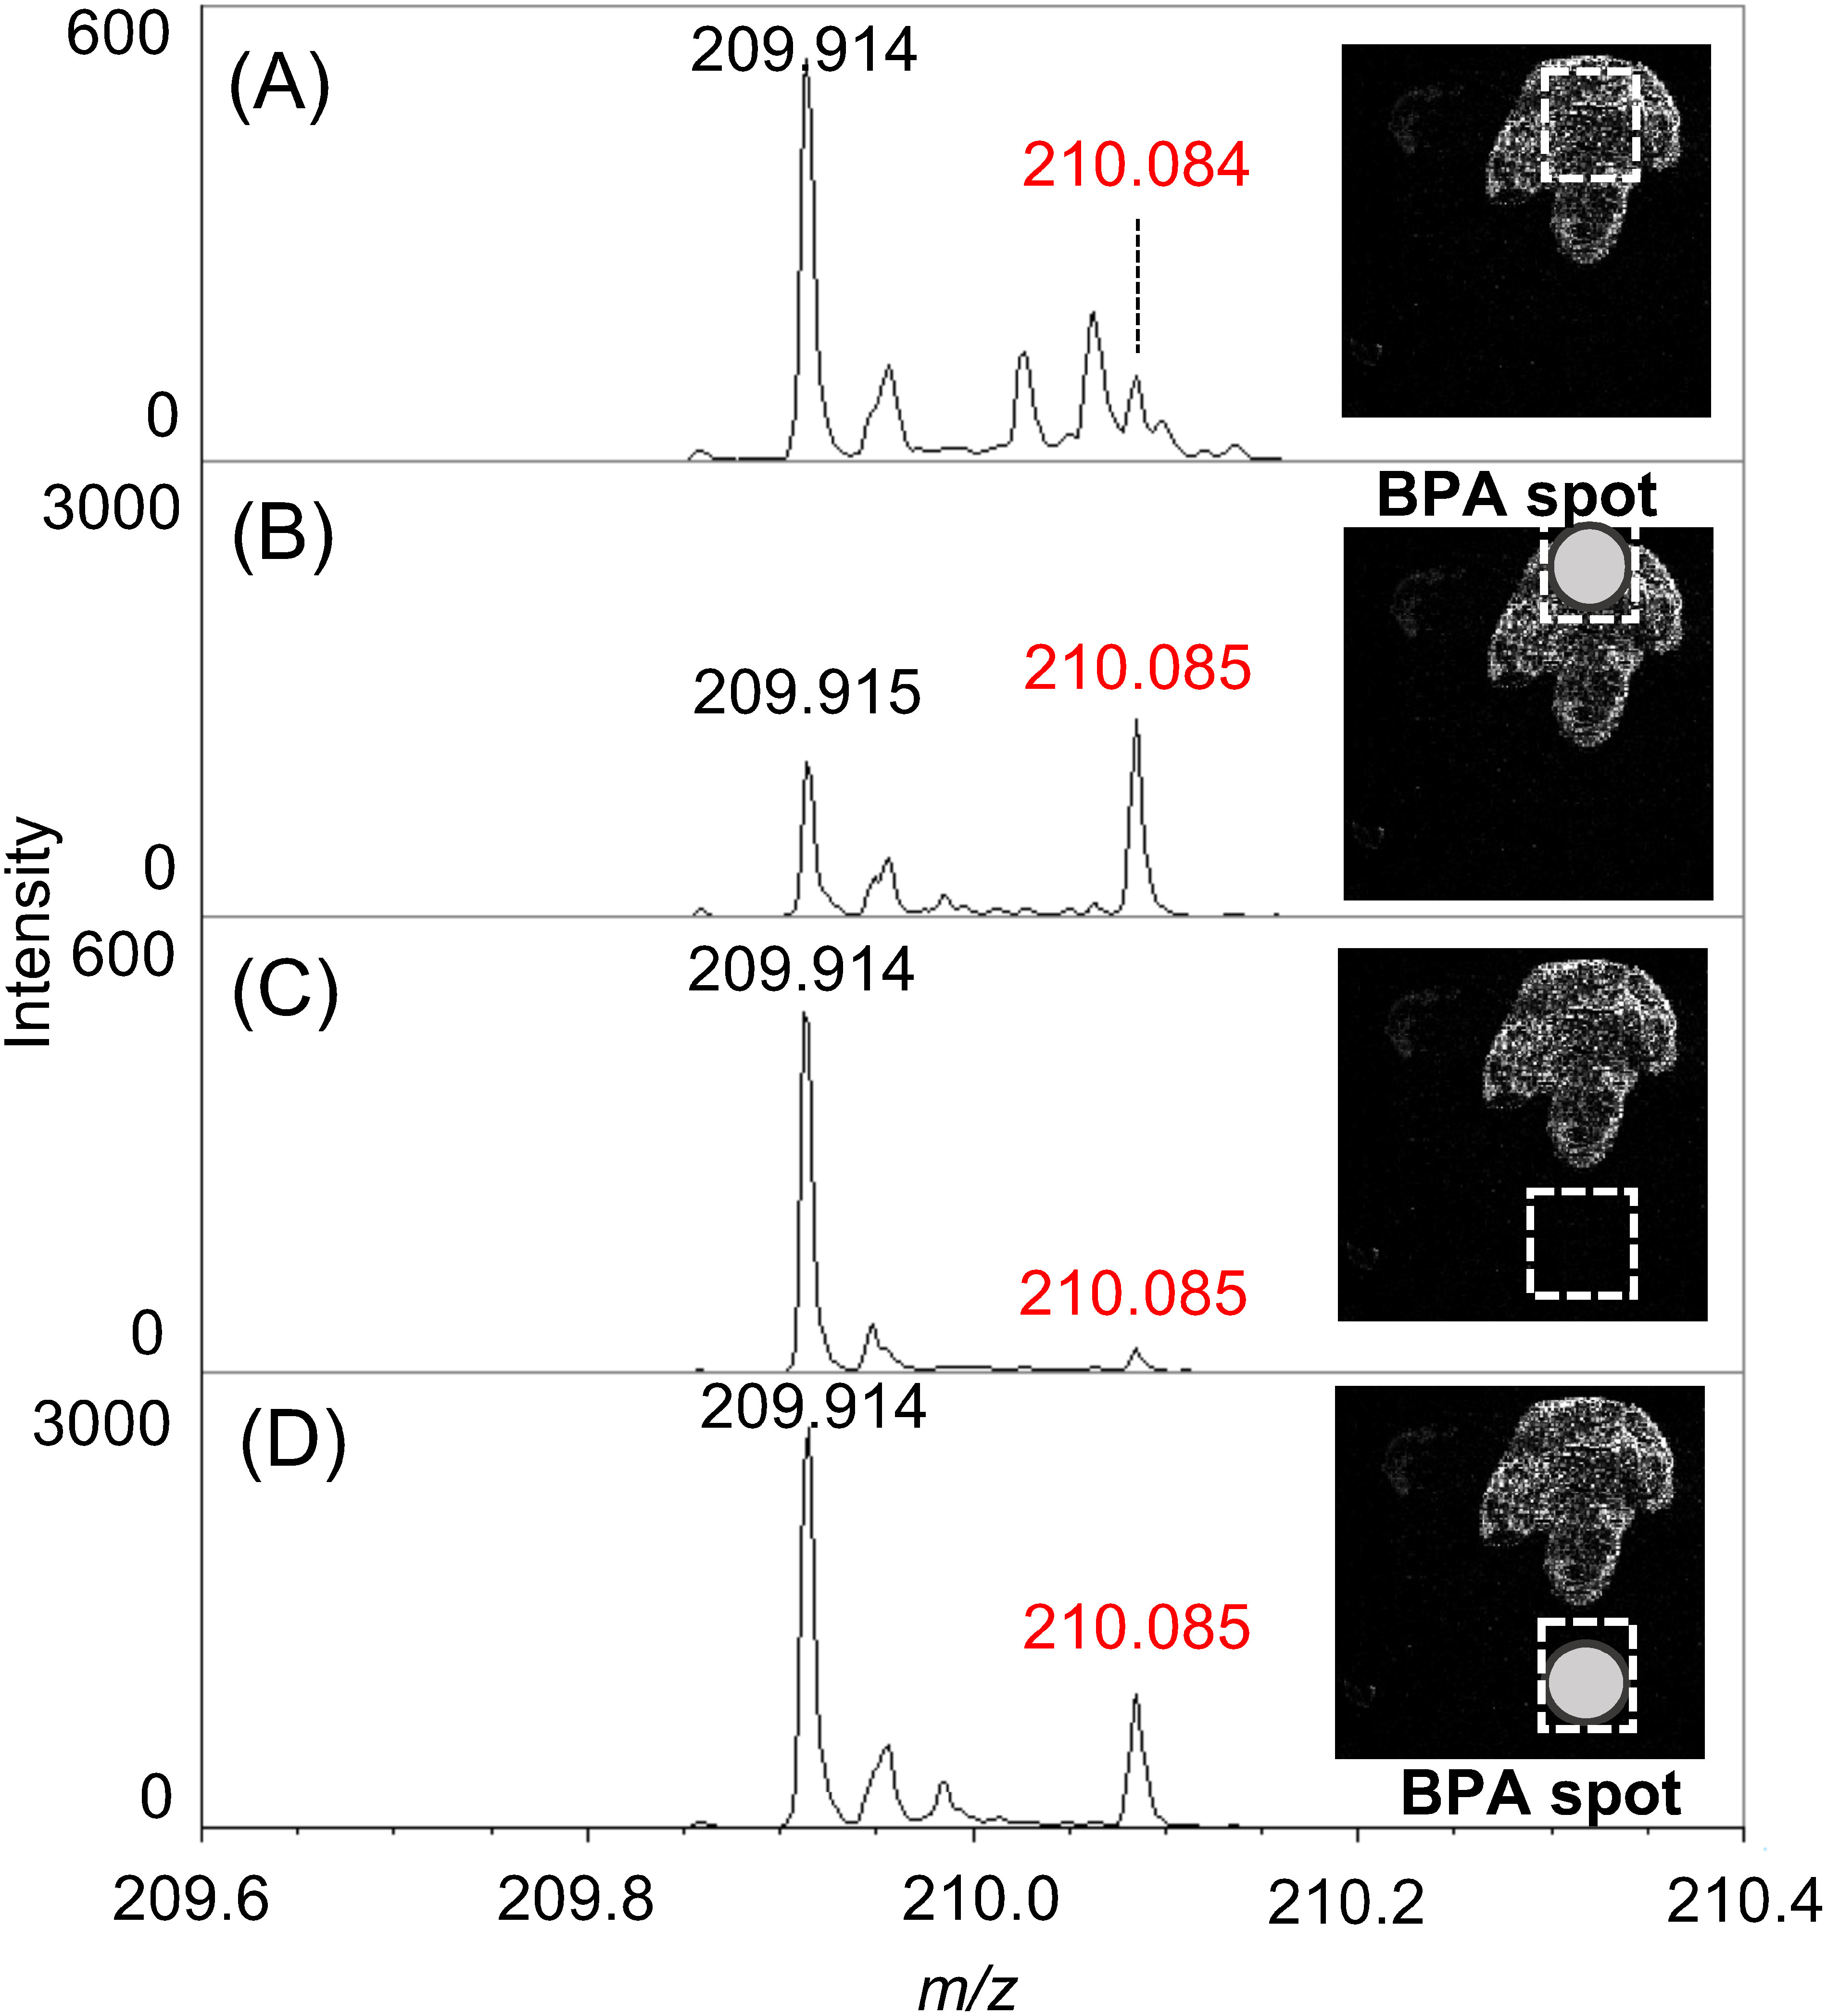
Fig. 5. Averaged mass spectra per a pixel extracted from (A) tumor region, (B) 10 pmol-BPA spotted tumor region, (C) cerebral cortex region and (D) 50 pmol-BPA spotted cerebral cortex region in the BPA dosed brain tissue section. Inserted figures show the position of spotted BPA and the ROI to extract mass spectra. The relative intensities of the peak at m/z 210.085 to the peak at m/z 209.9 increased after BPA spotting in tumor or cerebral cortex area.